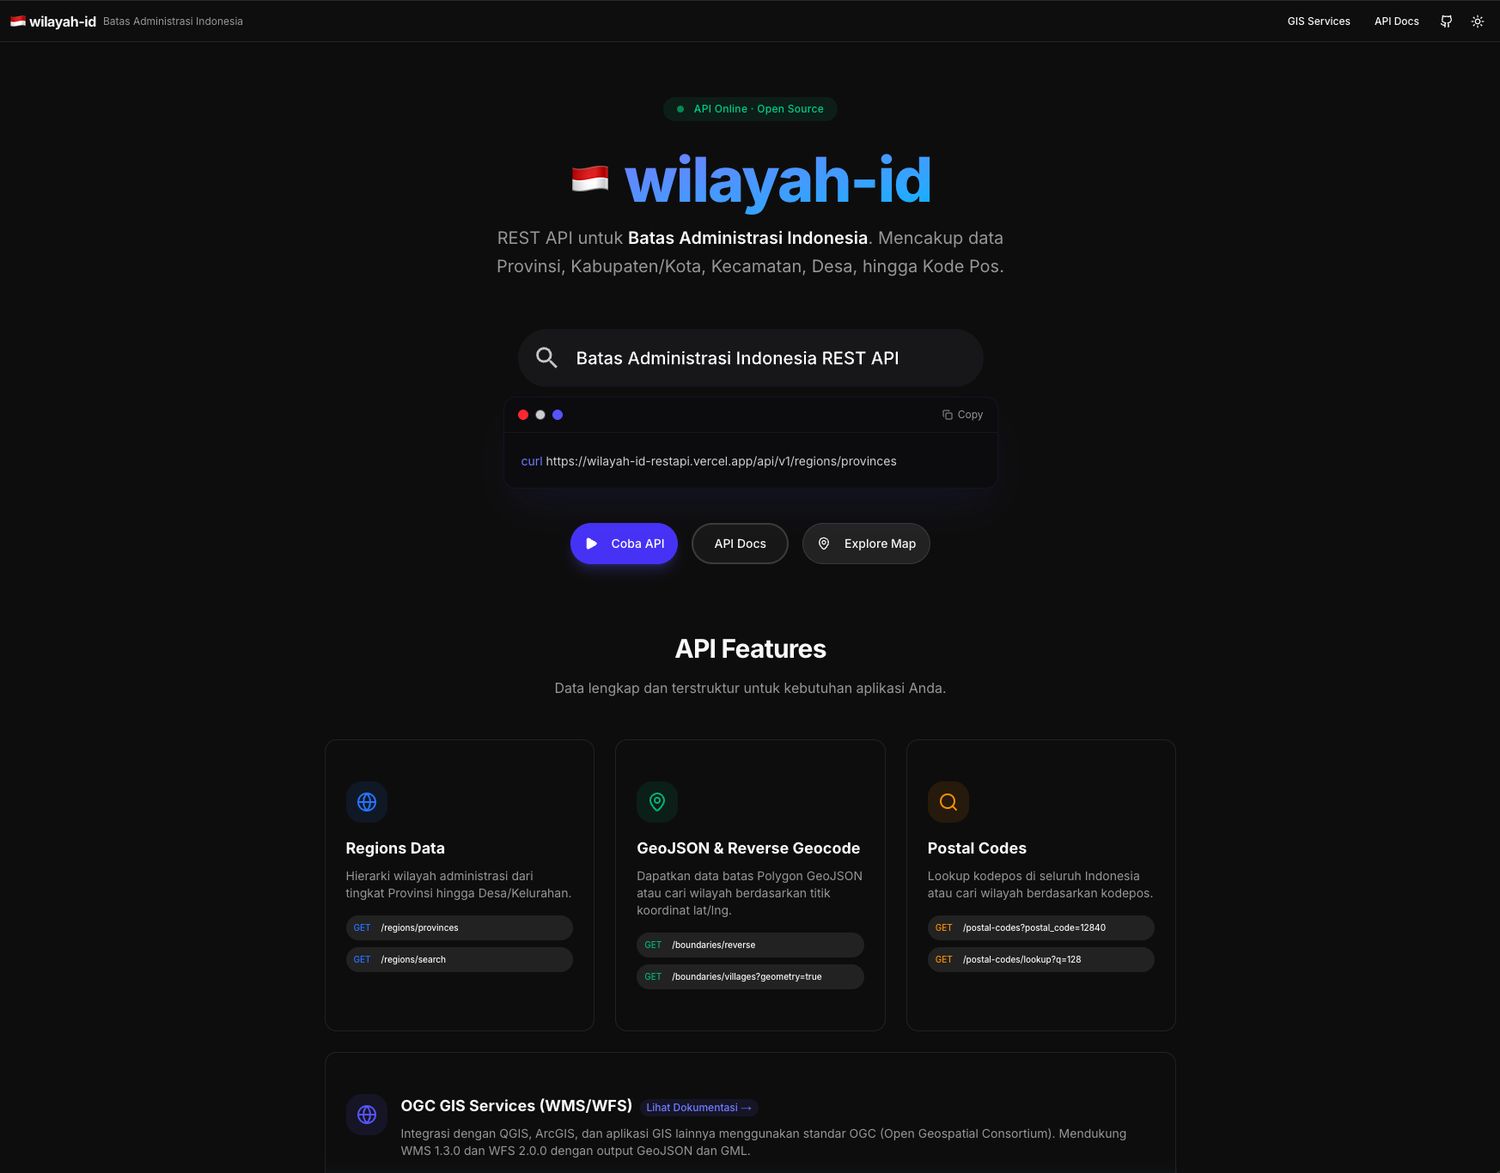
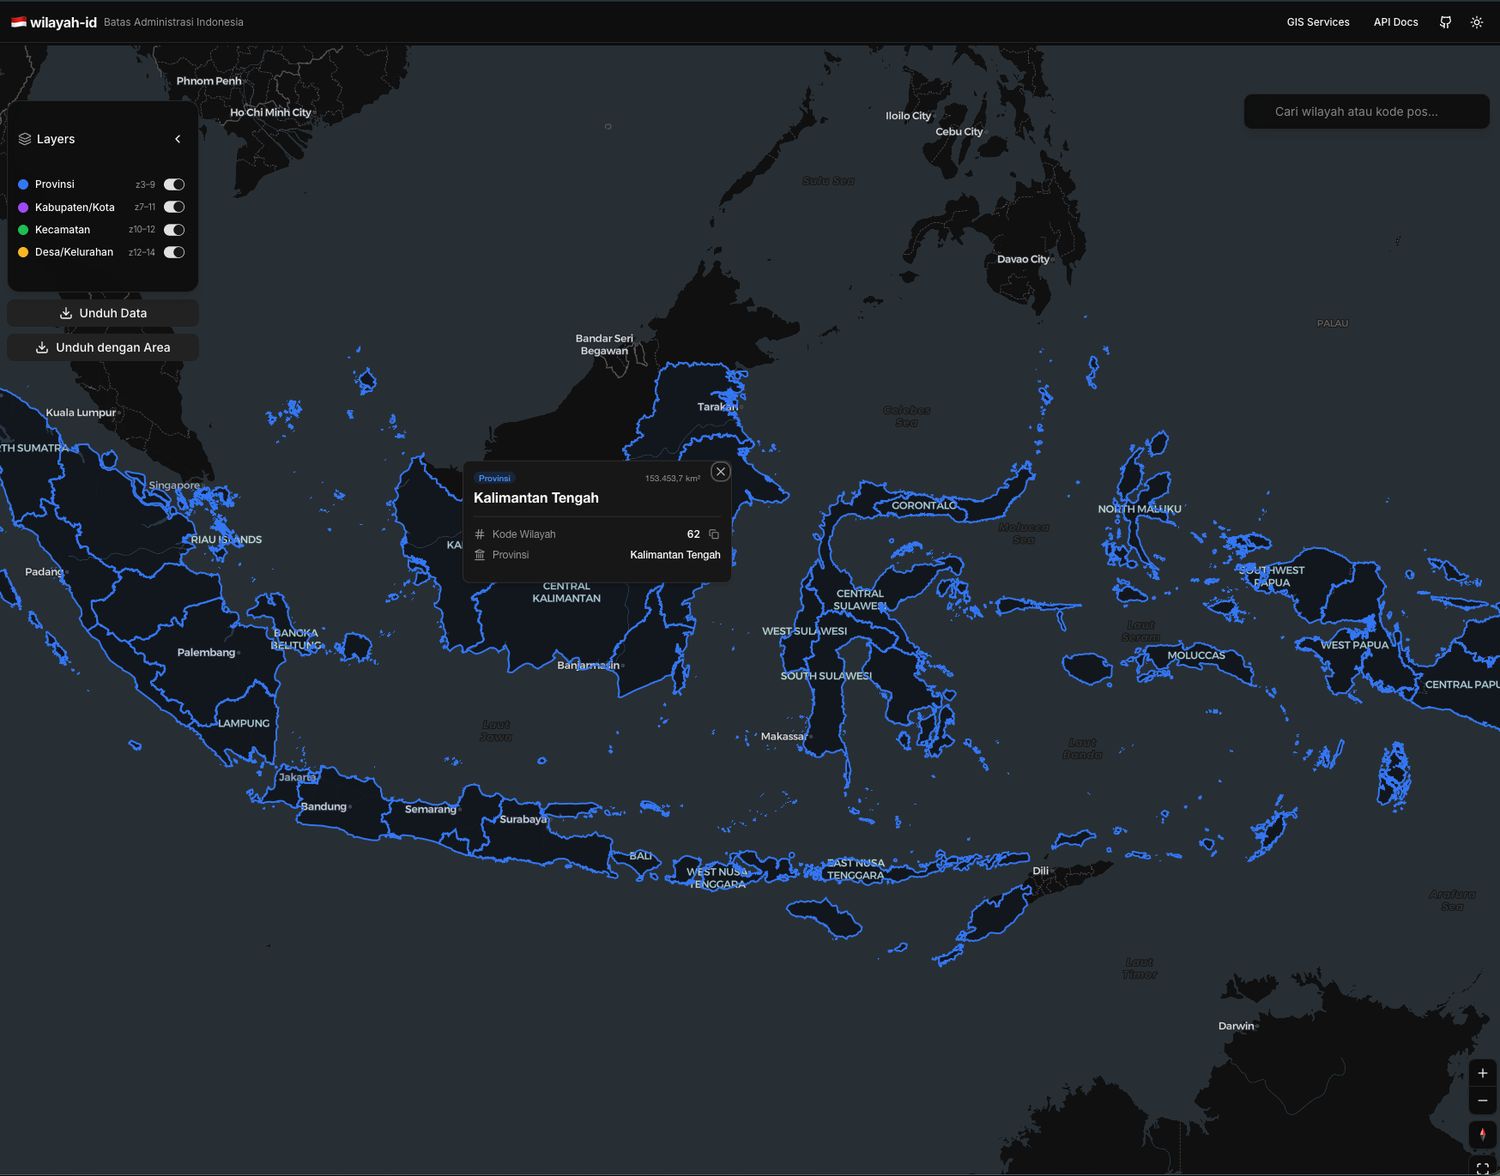
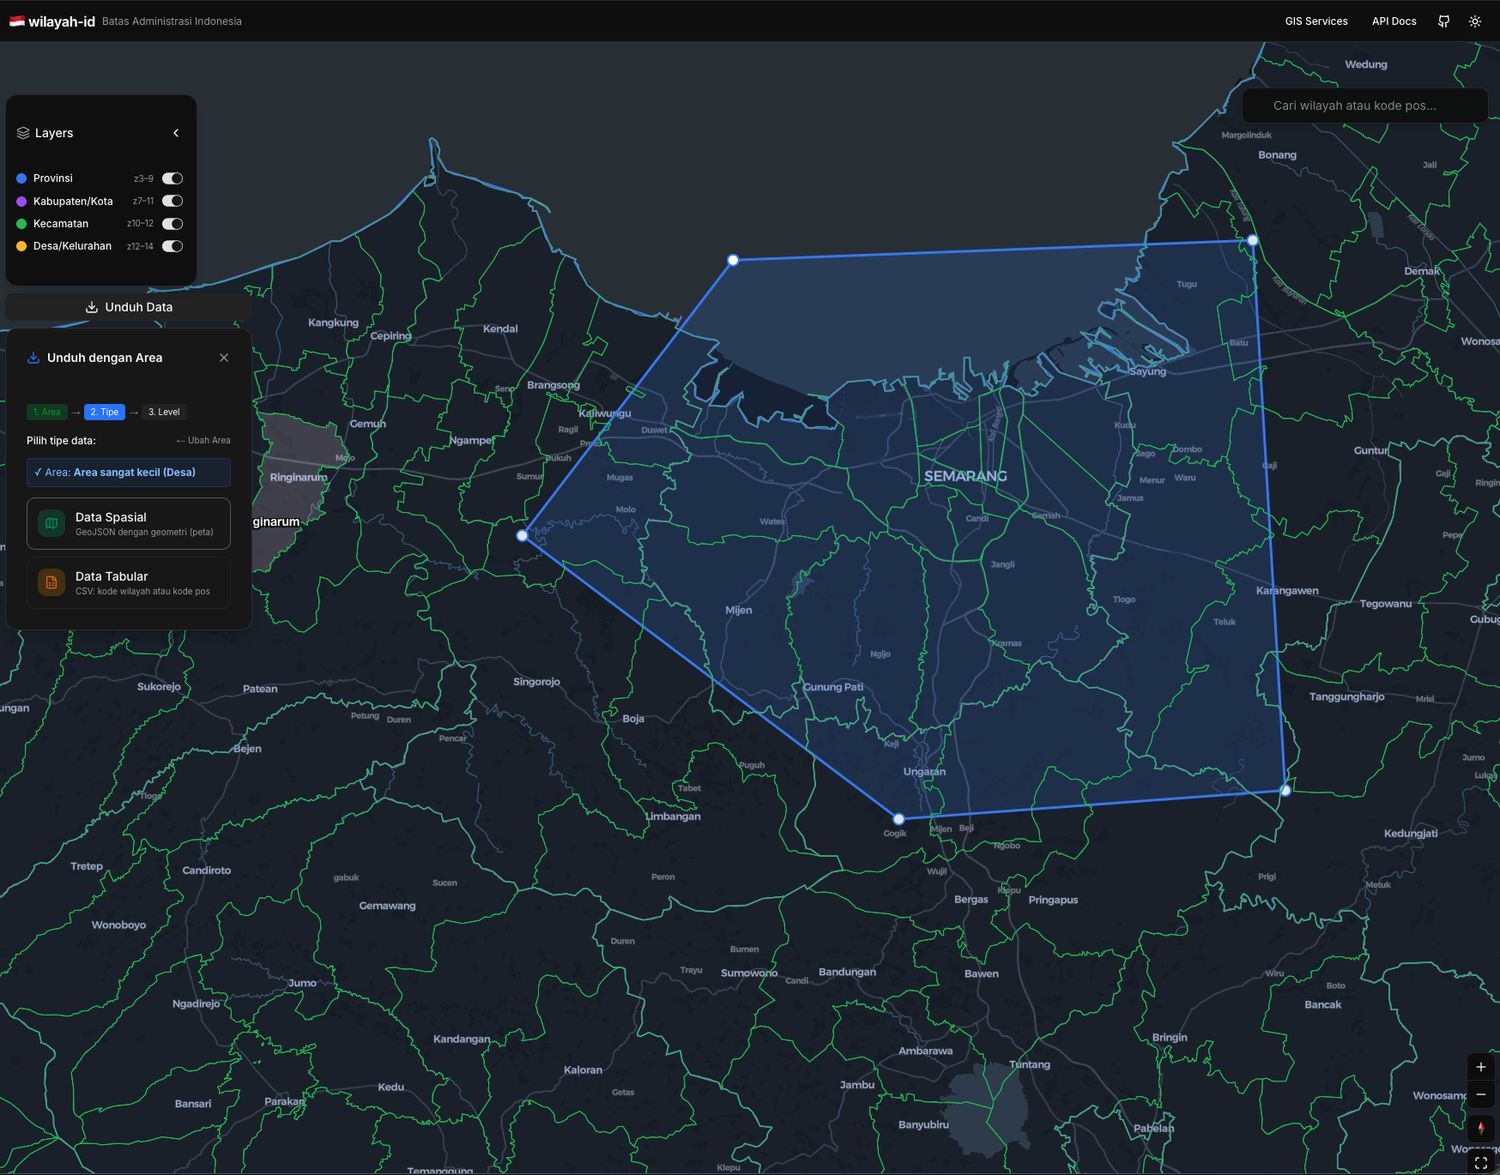
A comprehensive dataset and API serving the complete hierarchical administrative divisions of Indonesia, from Provinces and Regencies down to Districts and Villages (Kelurahan/Desa). This tool provides developers with highly structured geographical data essential for building location-aware applications, web mapping platforms, or spatial data analysis tools.
Data Standardization: Curated and served a unified, clean JSON structure representing the complex hierarchy of Indonesian administrative zones.
Developer Efficiency: Eliminated the need for manual scraping of government region datasets, providing a ready-to-use data source for web forms and maps.
High-Speed Retrieval: Structured the datasets for low-latency lookups, perfect for powering cascading dropdown menus in frontend applications.
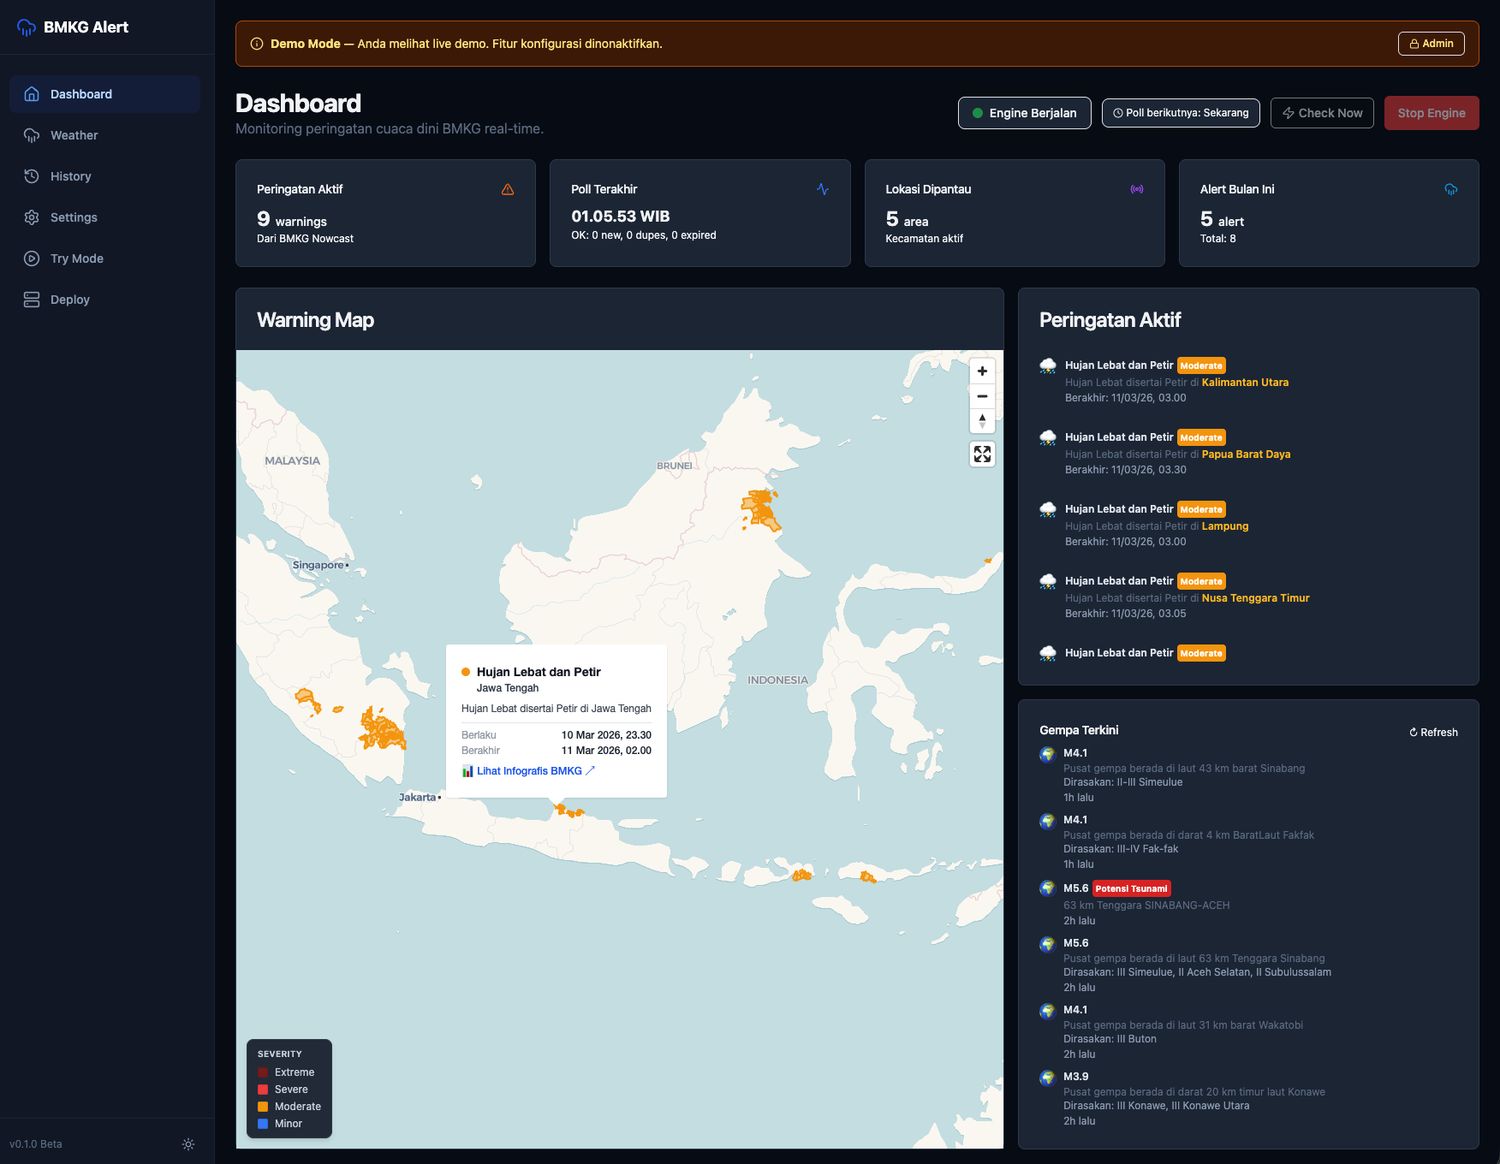
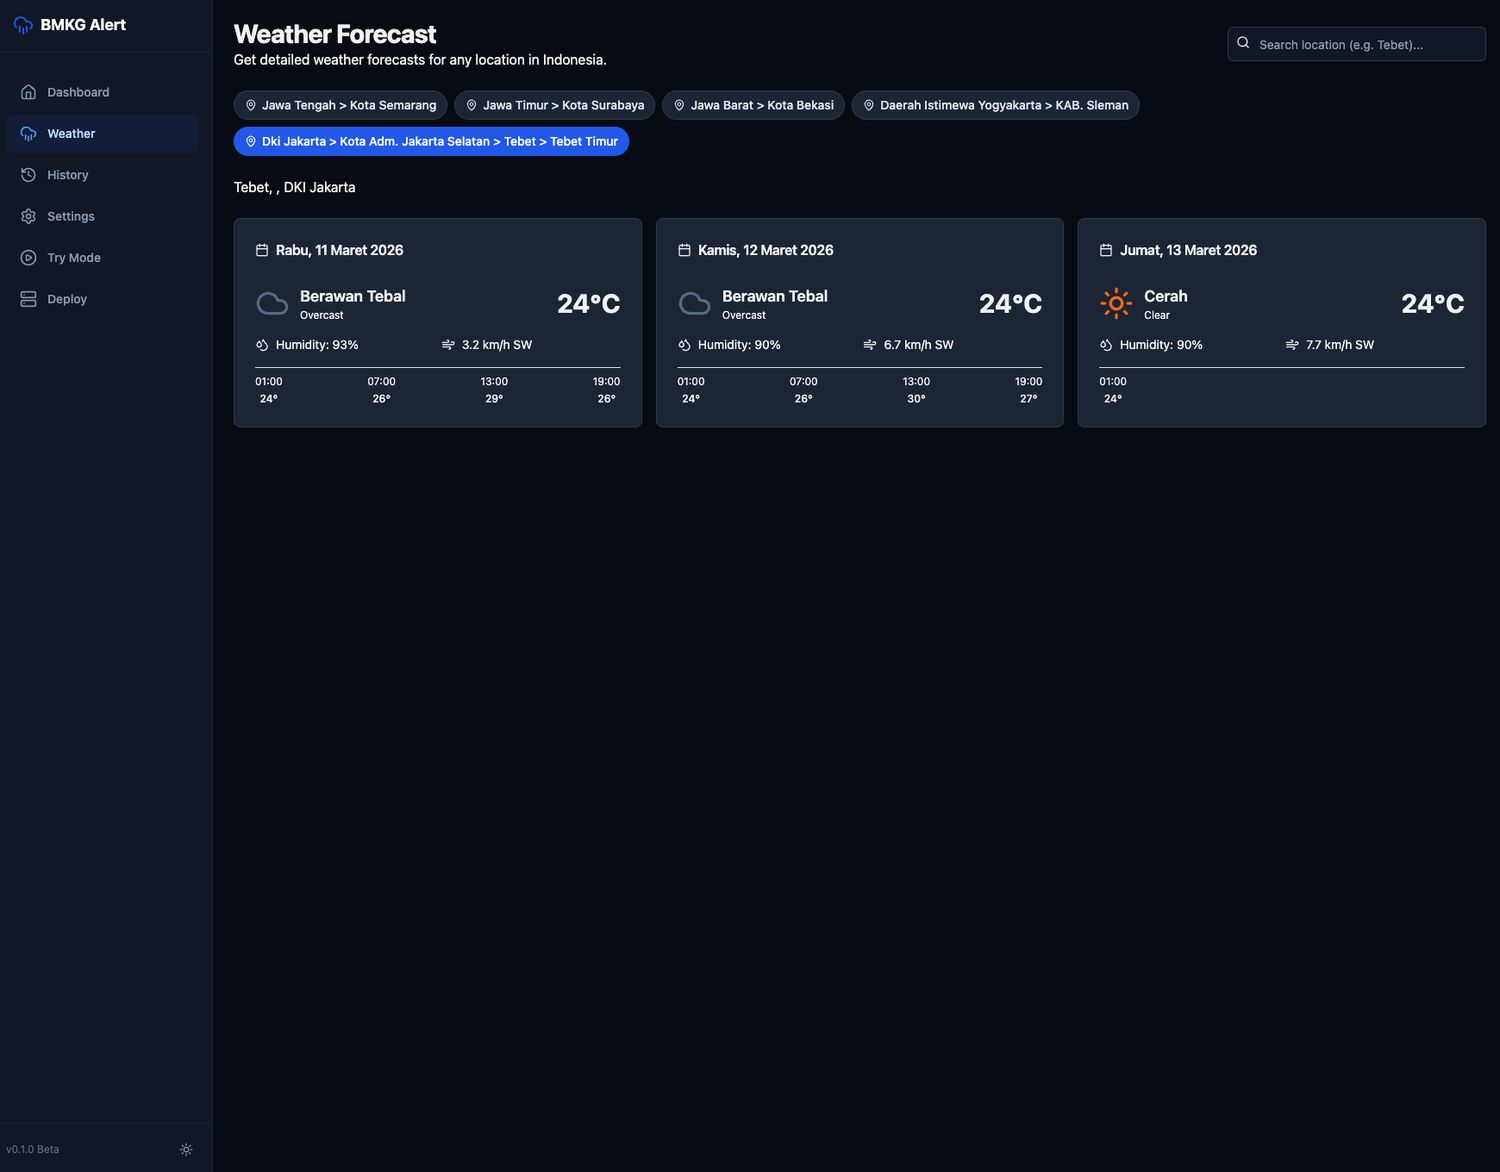
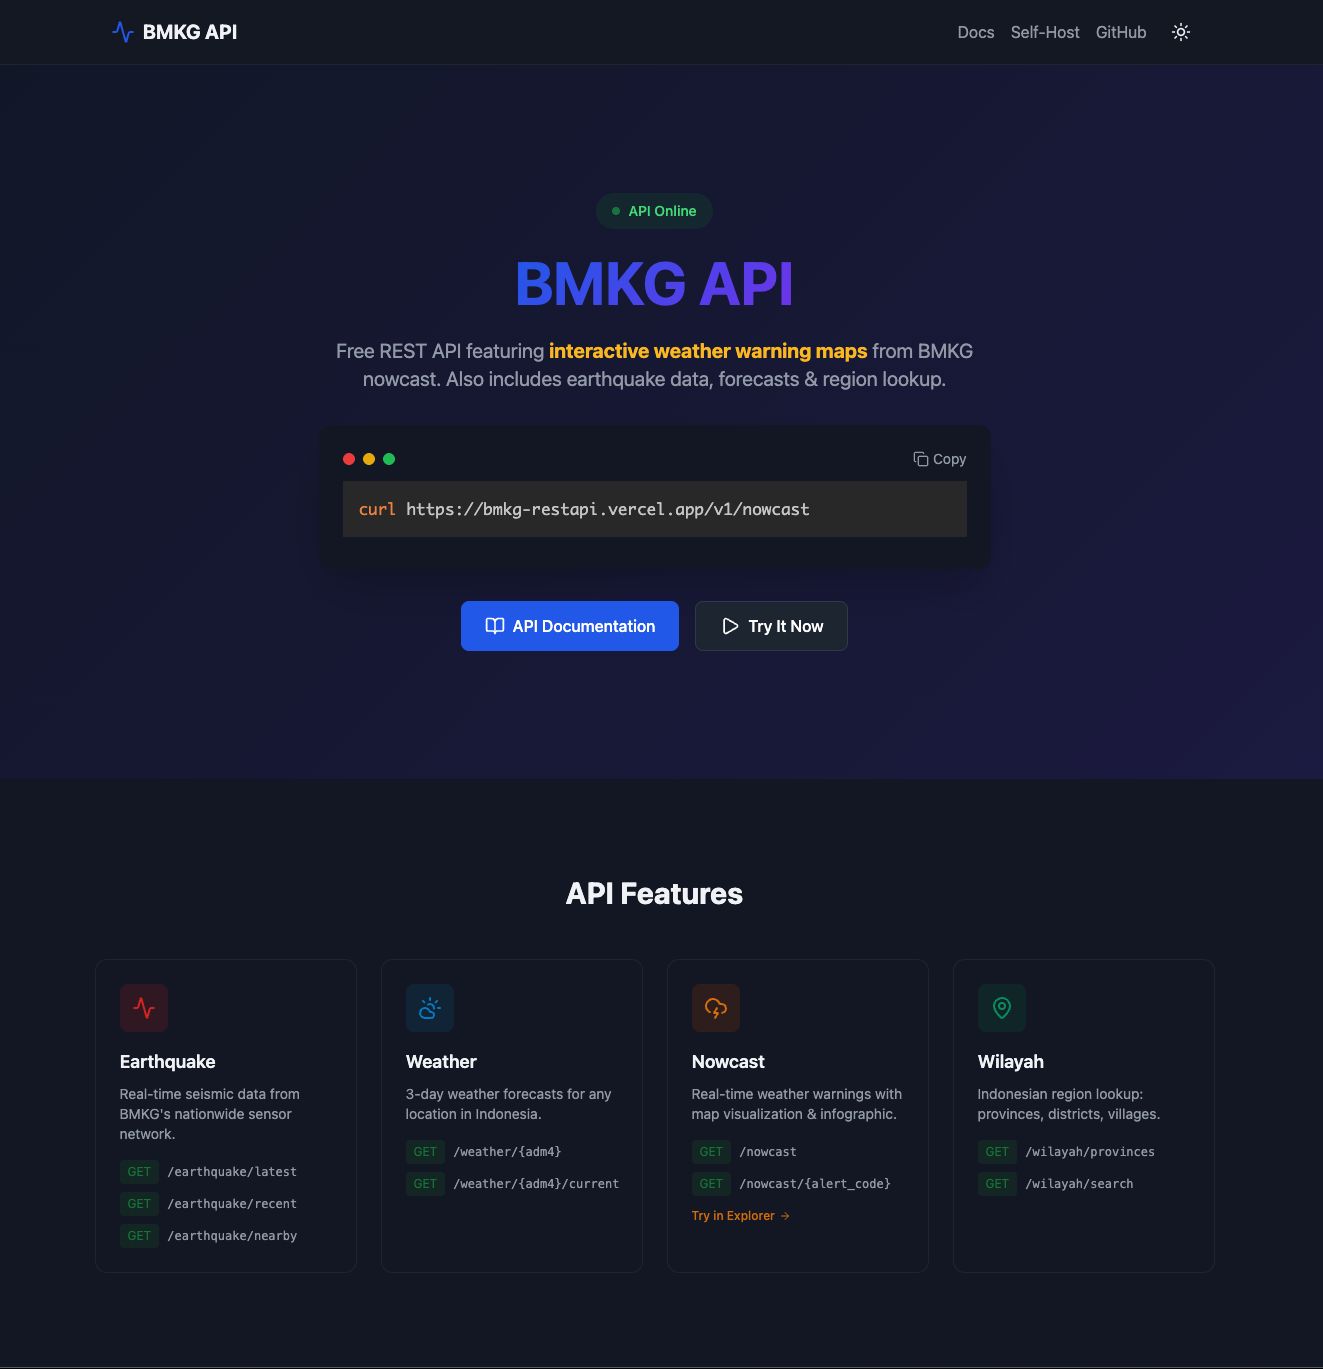
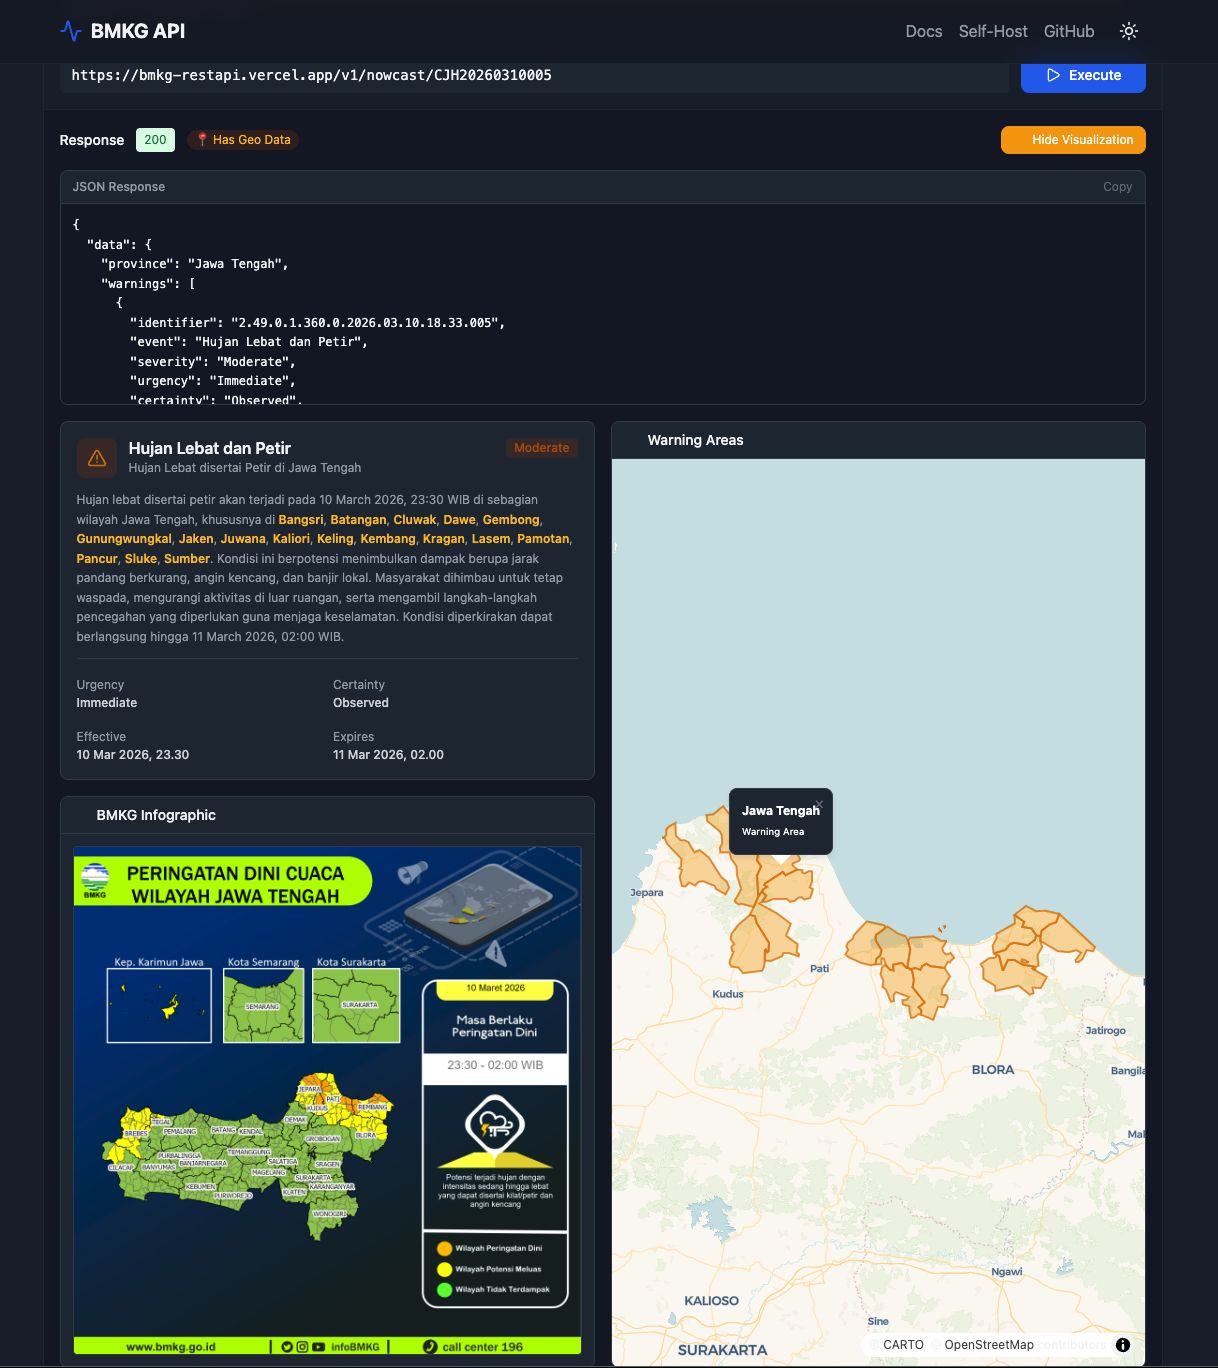
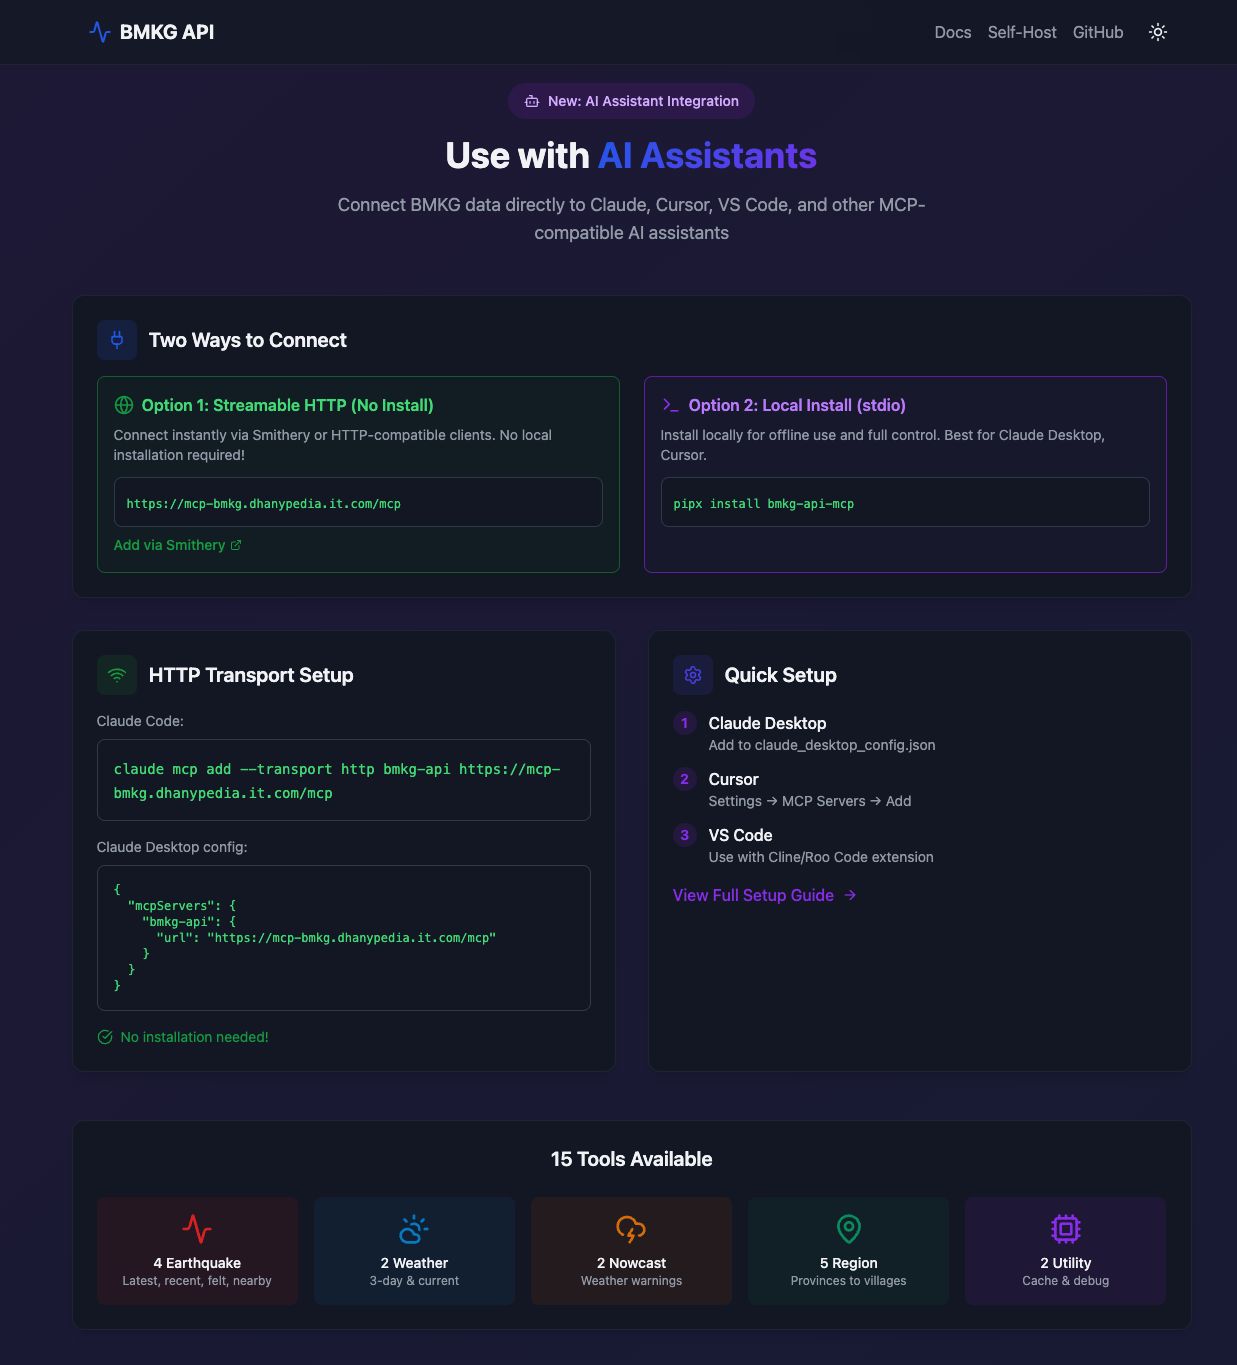
Developed a modern RESTful API wrapper for the Indonesian Agency for Meteorology, Climatology, and Geophysics (BMKG) open data. This project seamlessly converts legacy XML weather and earthquake data into developer-friendly JSON format. It features a robust Model Context Protocol (MCP) integration, allowing AI agents to natively query real-time Indonesian weather forecasts and seismic activity. The service is optimized for edge deployment on Vercel.
Data Modernization: Engineered an automated pipeline to convert complex BMKG XML feeds into clean, standardized JSON APIs.
AI-Ready Integration: Implemented an MCP server to allow AI assistants direct access to real-time meteorological and geophysical data.
Serverless Architecture: Packaged and deployed the wrapper on Vercel for high availability and zero-maintenance edge scaling.
REST API / JSON/XML Parsing / Model Context Protocol (MCP) / Vercel
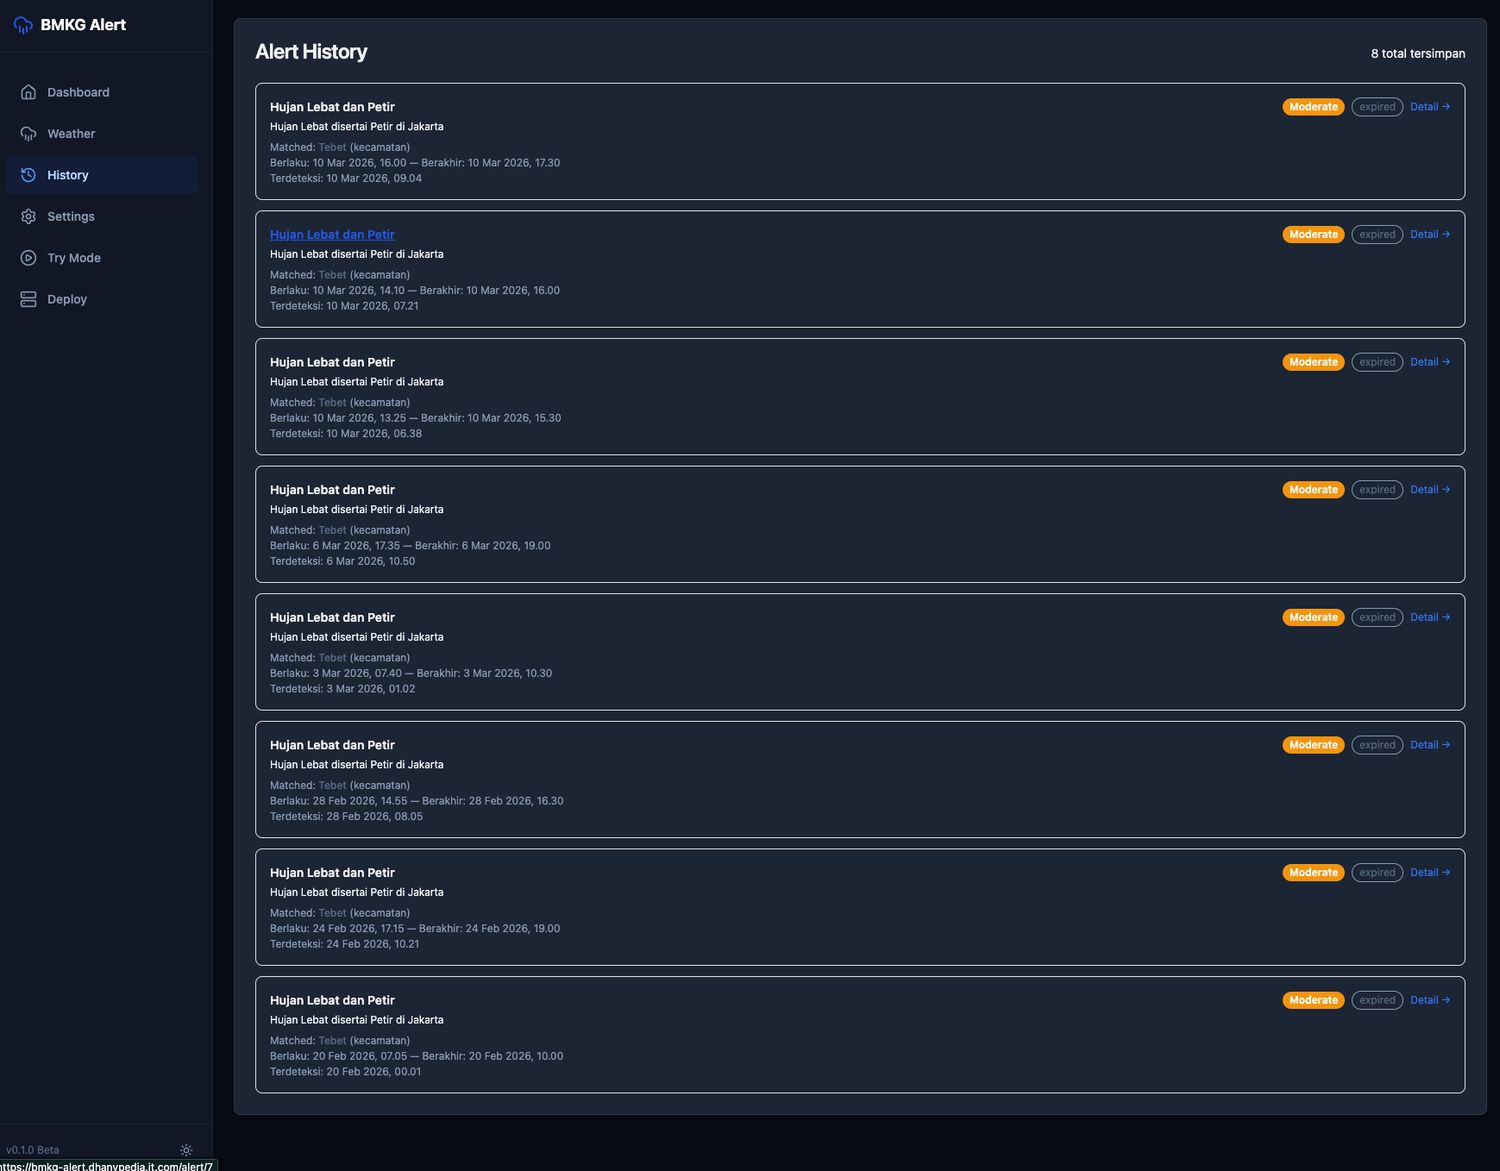
A real-time alerting service designed to monitor the BMKG API and dispatch instant notifications for significant weather events and earthquakes across Indonesia. The system continuously polls the data feeds and pushes formatted alerts to external messaging platforms via webhooks whenever predefined risk thresholds are met. Fully containerized with Docker for easy self-hosted deployment.
Proactive Monitoring: Built an automated polling engine that continuously tracks seismic and meteorological feeds for critical updates.
Real-Time Delivery: Integrated webhook pipelines to dispatch immediate, well-formatted alerts to end-users on messaging platforms.
DevOps Ready: Containerized the application via Docker, allowing seamless self-hosted deployment on environments like Proxmox.
TRAYEK is a map-based route optimization game in Indonesia that challenges players to sequence logistics stops against an AI solver (Nearest-Neighbor, 2-Opt) and the Valhalla routing engine. Players tackle 8 authentic Indonesian constraints: Jakarta odd-even plates, Semarang coastal tidal flooding, prayer breaks, one-way streets, and Nusantara (IKN) logistics corridors across 15 Indonesian cities.
Developed as an engineering initiative for #JuaraVibeCoding 2026 and selected in the Top 100 with recognition from Google Developer Groups in May 2026.
Top 100 #JuaraVibeCoding Season 1 (May 2026) by Google Developer Groups Live Indonesia & Vertex AI (Certificate ID: JVC2605-DFFS-KBGR).
Dual Cloud Run microservices architecture: Next.js 16 (strict TypeScript) frontend and high-performance Go backend for route simulation and attempt cooldowns.
Self-hosted Valhalla routing engine with multi-vehicle costing (motorcycle, auto, truck) and pre-baked distance matrix for zero-cost runtime routing.
Vertex AI integration (Gemini 3.1 Flash) with Google Search Grounding for narrative mission briefings and contextual explanations of local logistics constraints.
Covers 15 cities from Medan to Sorong with 36 archipelago logistics mission scenarios.
Next.js 16 / Go (Golang) / Valhalla / MapLibre GL / TypeScript / Vertex AI / Firestore / Google Cloud Run
TRAYEK Landing page: Pemilihan kota & armada logistik Nusantara (Truk, Box, Motor, Drone).
2025 · Singapore
Singapore Public Transport Data Intelligence & Visualization
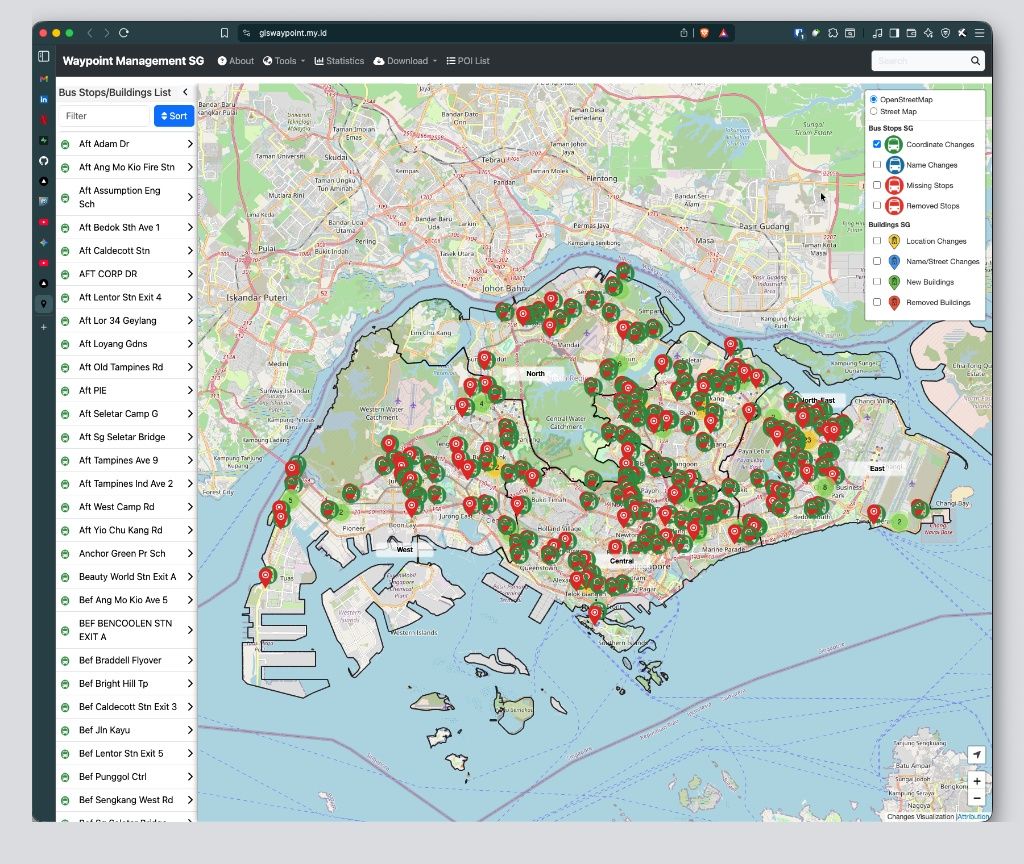
Developed a specialized geospatial intelligence tool to validate and visualize changes in Singapore's public transport infrastructure (SGERP database). This web application serves as a "Change Detection System," automatically identifying discrepancies such as shifted bus stop coordinates, renamed stations, and missing assets. By implementing the Haversine formula, the system calculates precise displacement distances, visualizing the movement of assets with dynamic connectors to aid urban planners in data verification.
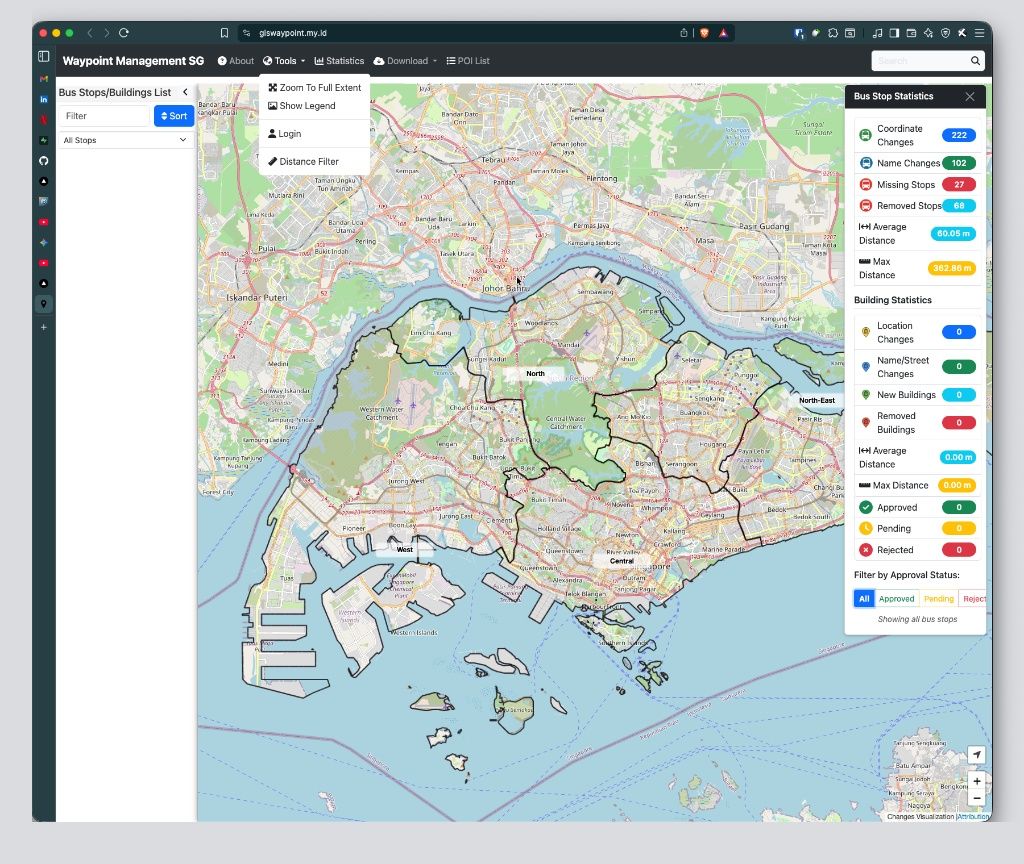
Automated Change Detection: Successfully categorized and visualized critical data updates, tracking 222 Coordinate Changes, 102 Name Changes, and 27 Missing Stops in a single dataset.
Movement Visualization: Engineered a visual logic that draws dashed lines connecting an asset's "Original Position" to its "New Position," helping stakeholders visualize infrastructure shifts instantly.
Real-Time Analytics: Built a dynamic statistics panel that calculates key metrics on the fly, such as the "Average Distance" of bus stop shifts (60.05 m) and identifying extreme outliers (Max Distance: 362.86 m).
User-Centric Search: Implemented an advanced "Typeahead" search engine allowing users to filter assets by category (e.g., Missing Stops, Removed Buildings) for rapid data auditing.
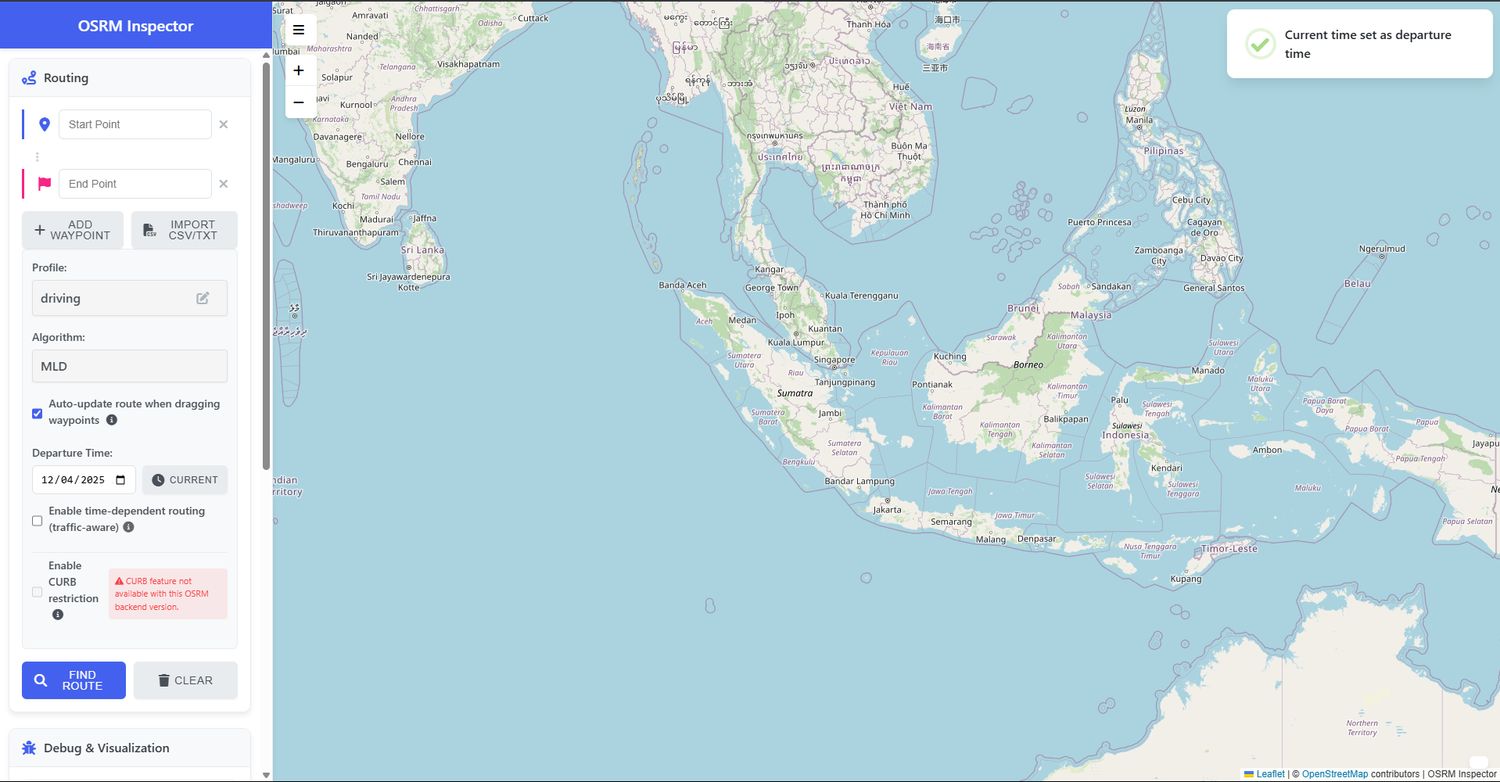
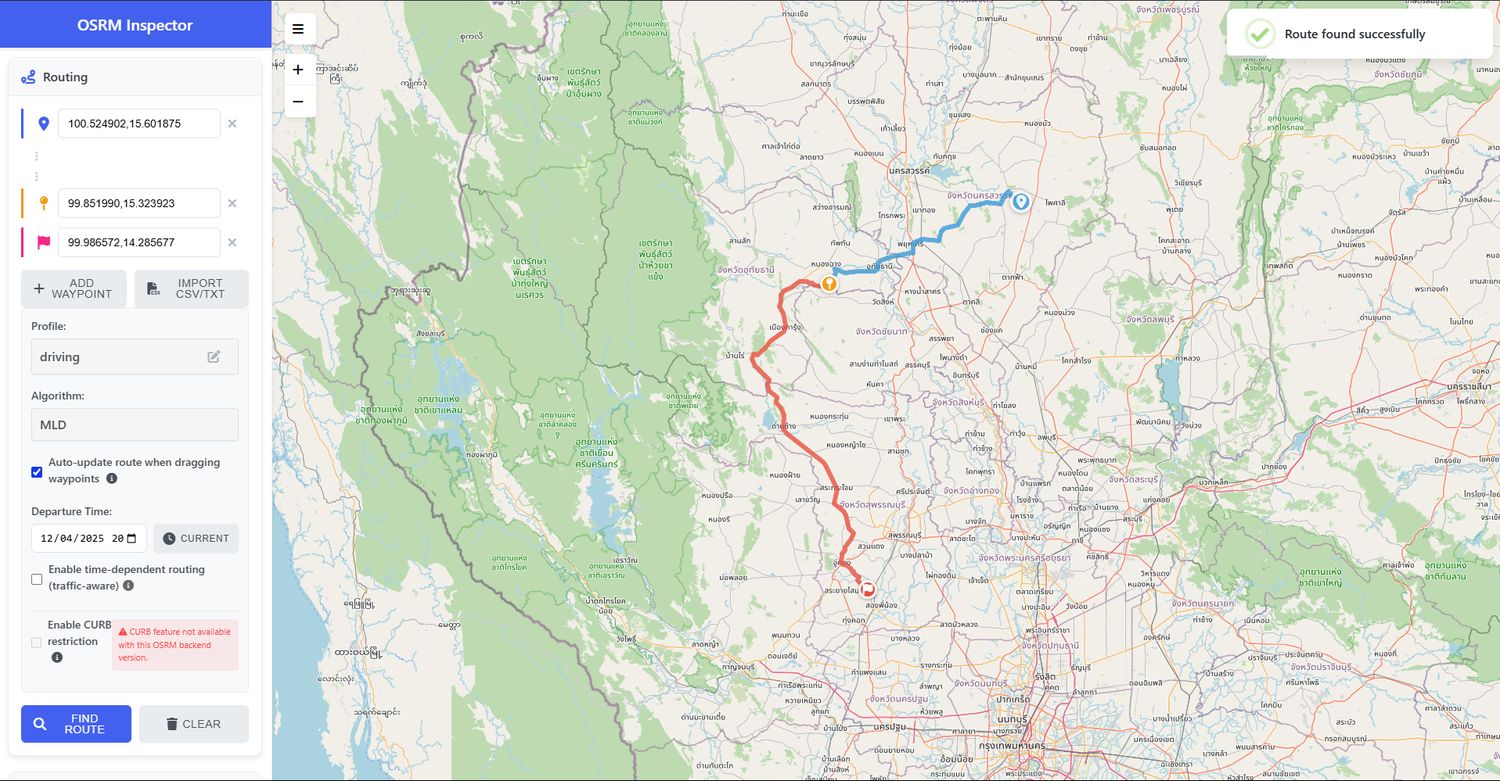
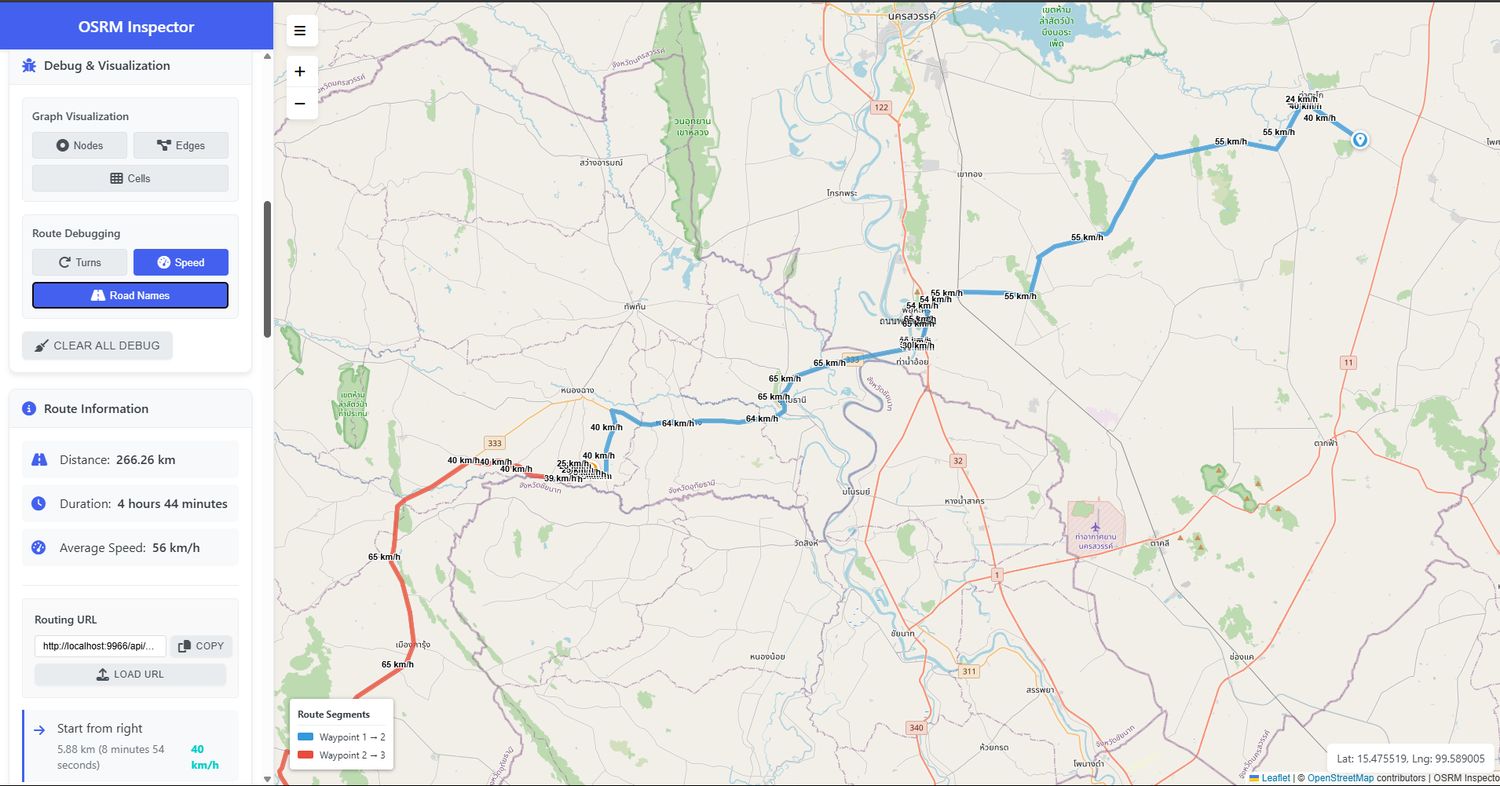
Developed a modern, containerized frontend application designed to interact with the Open Source Routing Machine (OSRM) backend. This tool fills a critical gap in the geospatial development ecosystem by providing a GUI to debug complex routing algorithms. It allows developers to visualize network nodes, edges, and speed profiles, making it easier to troubleshoot routing errors in custom map data. The application is fully Dockerized for rapid deployment.
Algorithm Visualization: Engineered a "Debug Mode" that visualizes the invisible graph network—displaying Nodes, Edges, Cells, and Turn Instructions directly on the map.
DevOps Ready: Packaged the entire application as a Docker Image (dhanyyudi/myosrm-frontend), enabling other developers to deploy the tool in seconds via a single command.
Routing Intelligence: Implemented advanced profile support (Car, Bike, Foot) and detailed metrics (Average Speed, Turn-by-Turn Duration), aiding in the calibration of logistics route planning.
Data Interoperability: Built a CSV Import/Export engine, allowing users to batch-process waypoints and integrate the tool into larger data pipelines.
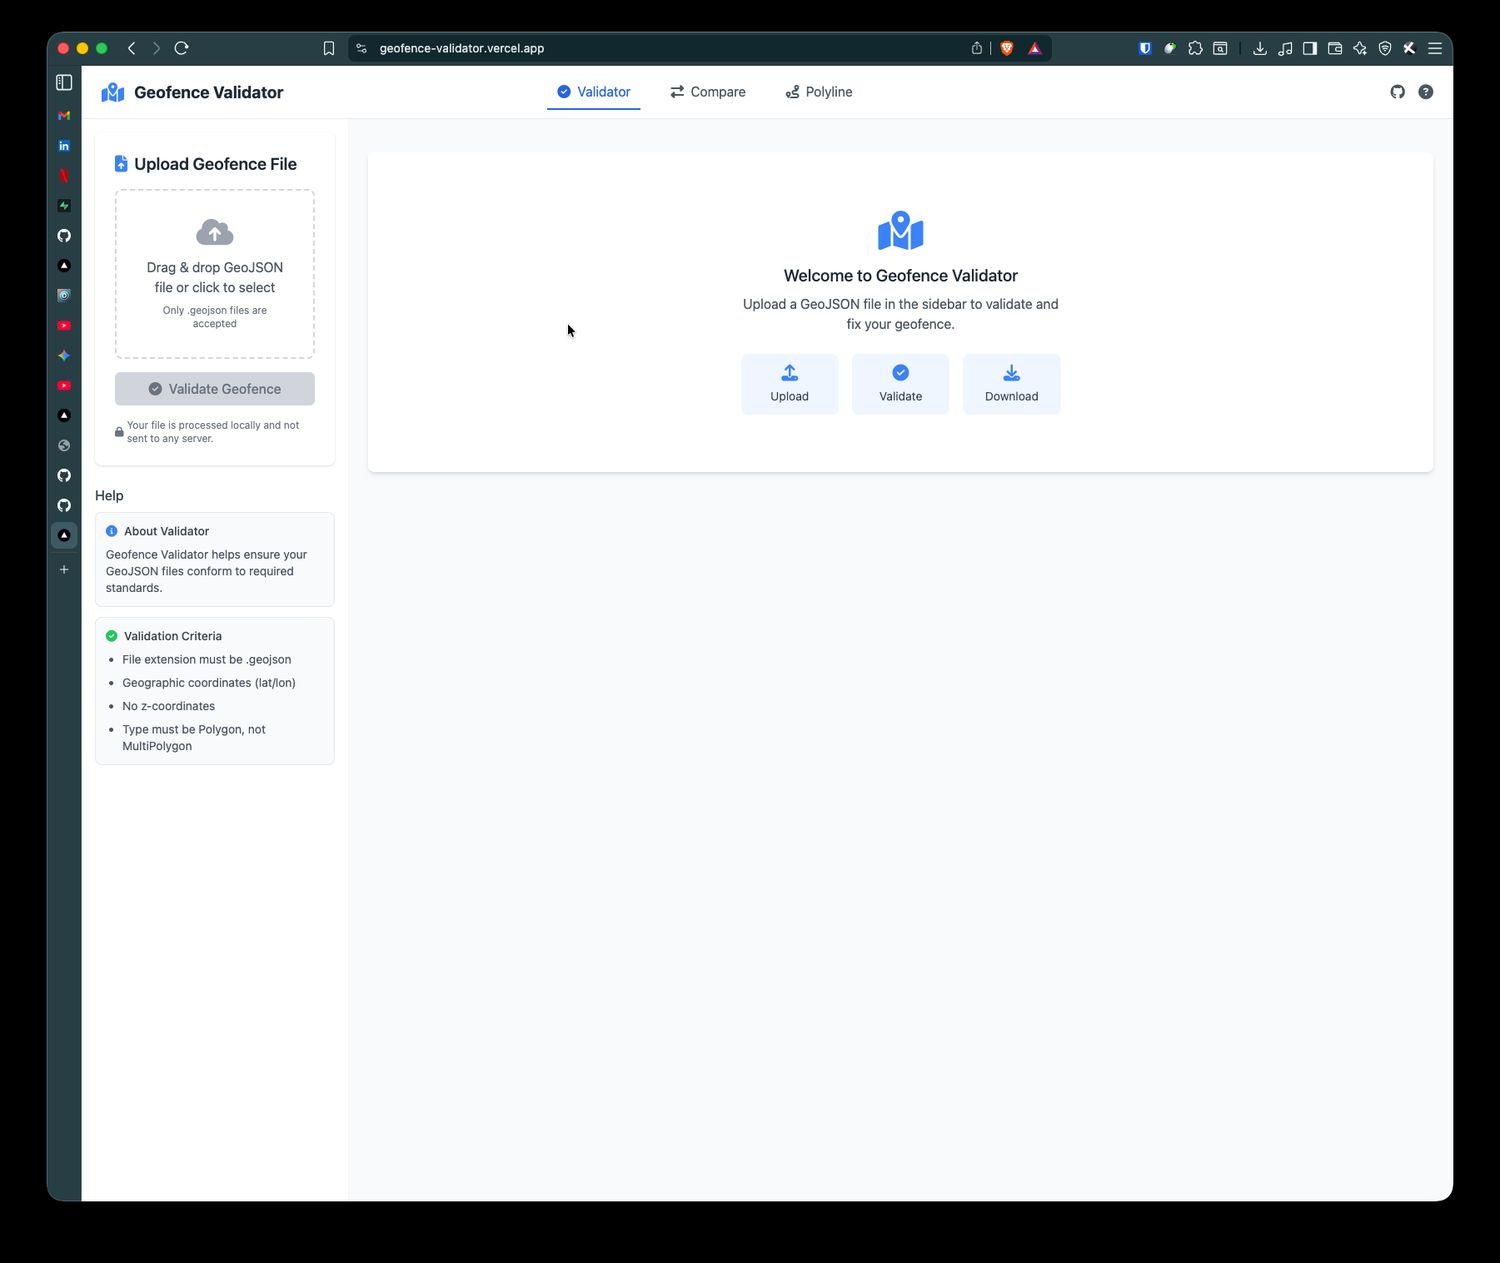
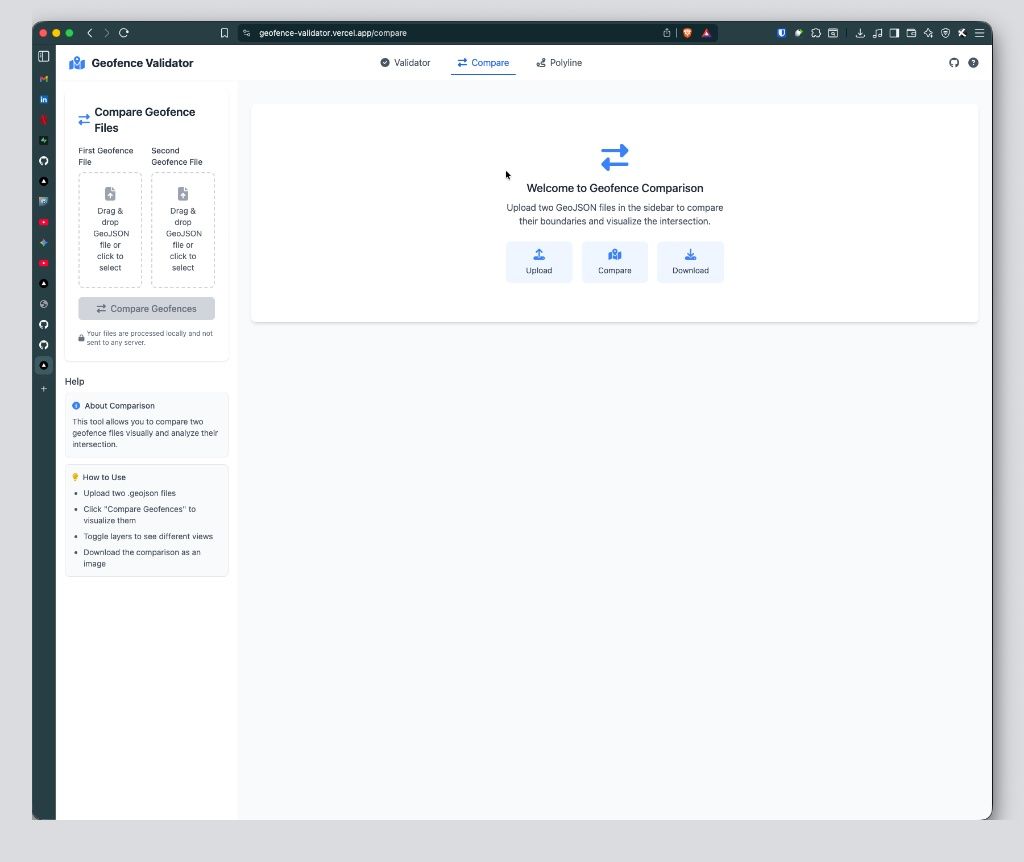
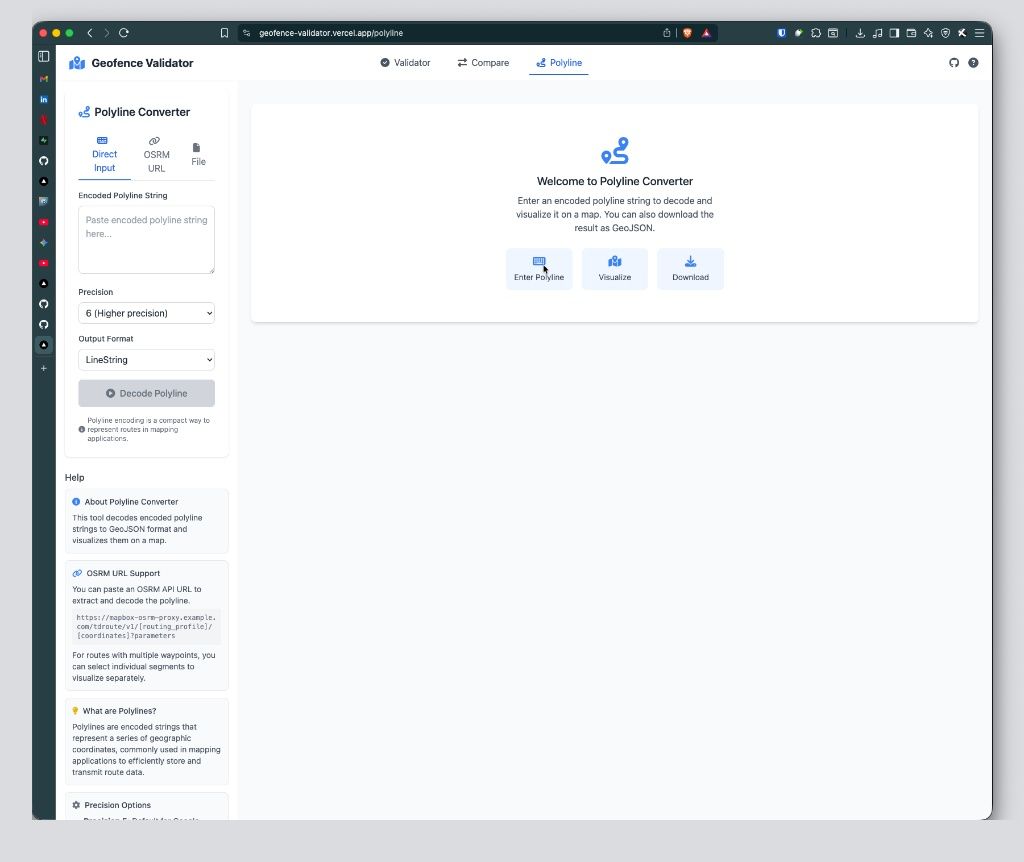
Developed a comprehensive web-based utility to validate, repair, and analyze GeoJSON files for geospatial developers. Built on Next.js 15 and React 19, this application solves common interoperability issues by automatically detecting and fixing geometry errors (e.g., removing Z-coordinates, converting MultiPolygons). It features a robust comparison engine and a Polyline decoder compatible with OSRM, all processing data securely on the client-side to ensure privacy.
Automated Data Quality: Engineered an intelligent validator that instantly identifies and fixes critical GeoJSON errors, such as invalid coordinate systems or incompatible "MultiPolygon" structures, streamlining database imports for developers.
Spatial Comparison Engine: Created a visual "Diff Tool" for maps, allowing users to overlay two geofence files and automatically calculate/visualize the intersection area to detect overlaps.
Advanced Routing Integration: Developed a "Polyline Converter" that decodes encoded strings directly from OSRM API URLs, helping logistics developers debug route geometries with precision levels of 5 or 6.
Privacy-First Architecture: Designed the entire processing pipeline to run client-side (in-browser), ensuring that sensitive geospatial data is never uploaded to external servers.
Enterprise Asset Management System for Trans Sumatra Toll Road
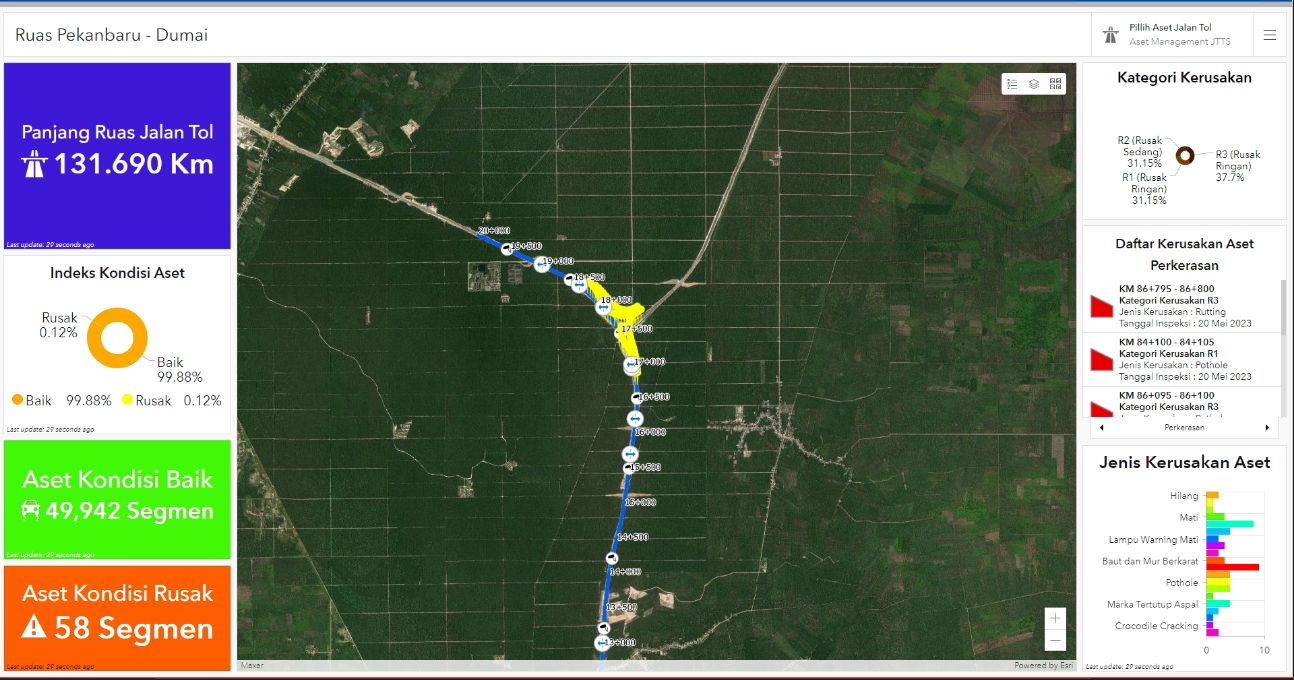
Architected a comprehensive Asset Management Dashboard for PT Hutama Karya (Persero) to digitize the maintenance lifecycle of the Trans Sumatra Toll Road. By integrating ArcGIS Enterprise with LiDAR and UAV survey data, the system creates a "Digital Twin" of the toll road infrastructure. This platform replaces manual reporting with real-time analytics, allowing engineers to track pavement conditions, identify damage types (e.g., potholes, rutting), and prioritize maintenance budgets based on precise geospatial evidence.
Real-Time Health Monitoring: Successfully monitored a 131.69 km toll road segment, providing instant visibility into the "Asset Condition Index" (99.88% Good Condition vs. 0.12% Damaged).
Granular Damage Detection: Categorized and geolocated specific asset failures, identifying exactly 58 segments requiring immediate repair out of nearly 50,000 segments.
Maintenance Prioritization: Visualized specific damage types such as "Potholes," "Rutting," and "Crocodile Cracking," enabling field teams to deploy the correct machinery and materials efficiently.
Operational Efficiency: Reduced inspection reporting time by integrating field survey data directly into the executive dashboard, eliminating manual data entry bottlenecks.
ArcGIS Enterprise / LiDAR & UAV Data Integration (3D Terrain Models) / Python (Automated Data Processing) / Operations Dashboard for ArcGIS / ArcGIS Server
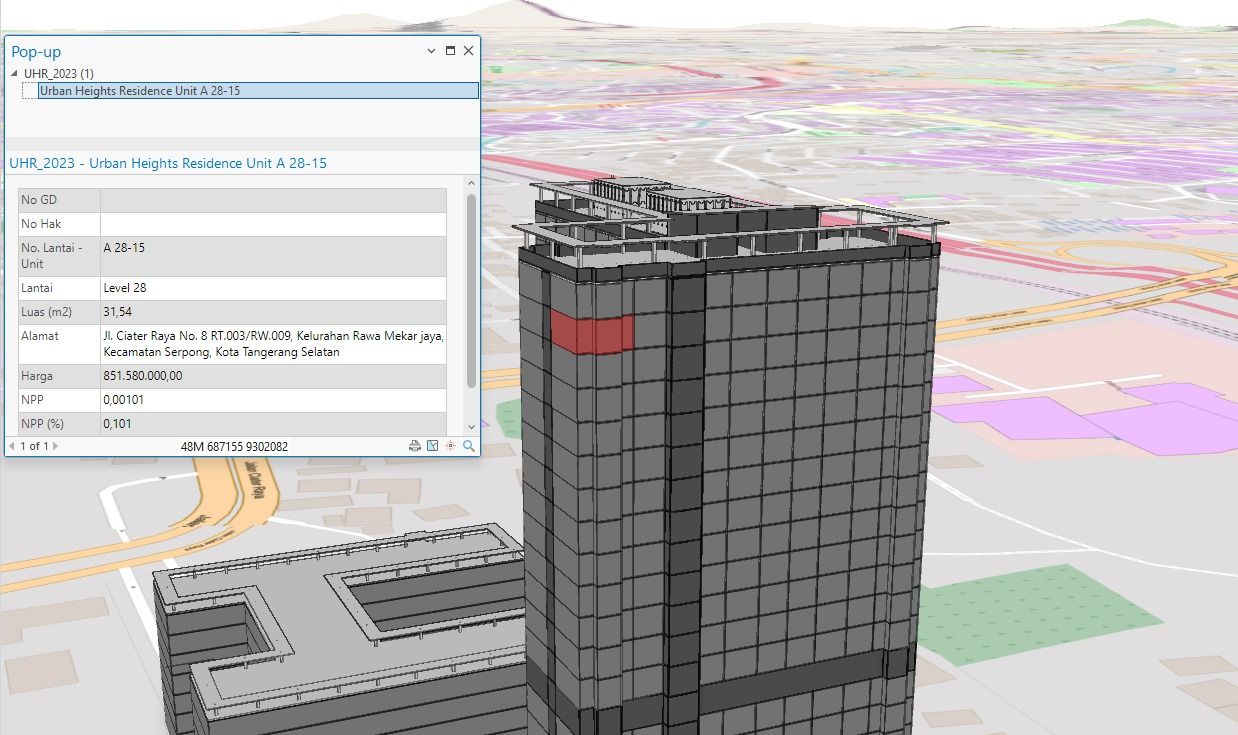
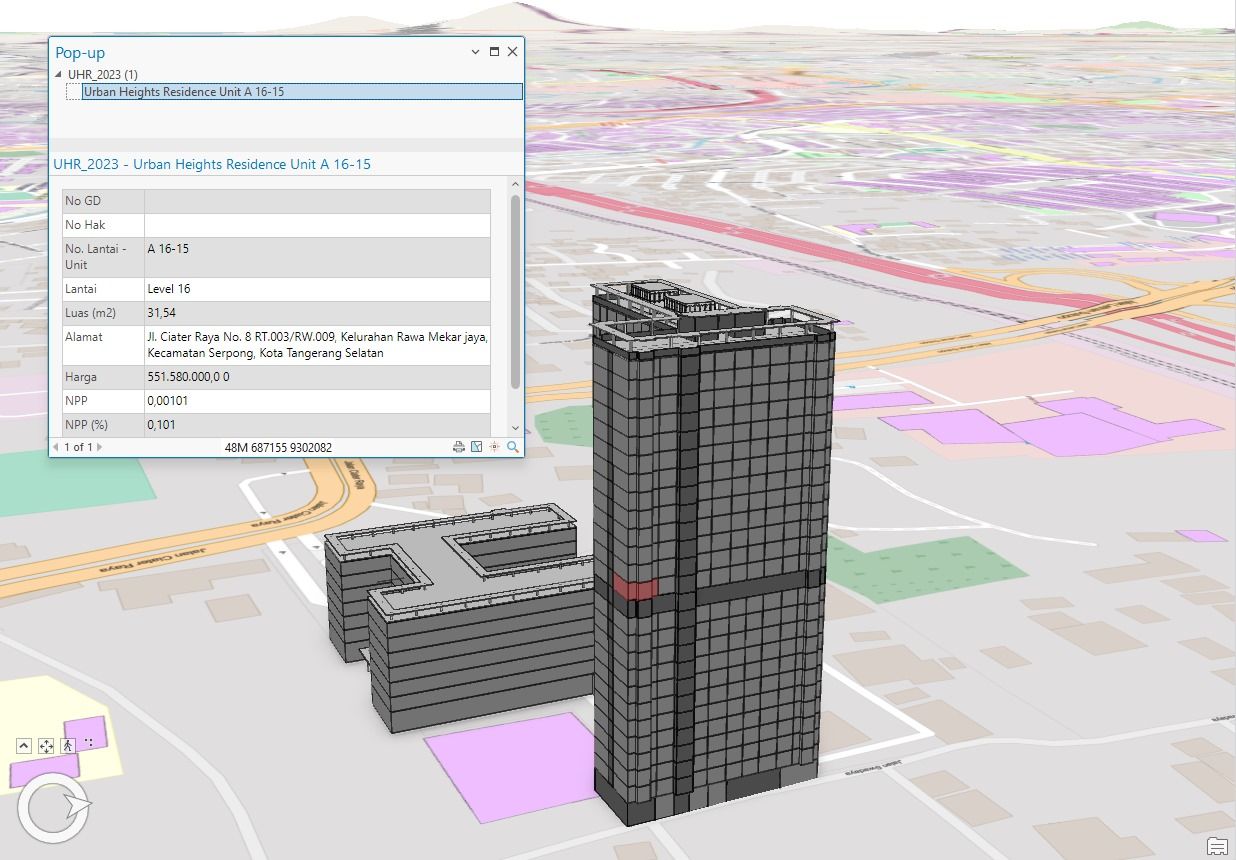
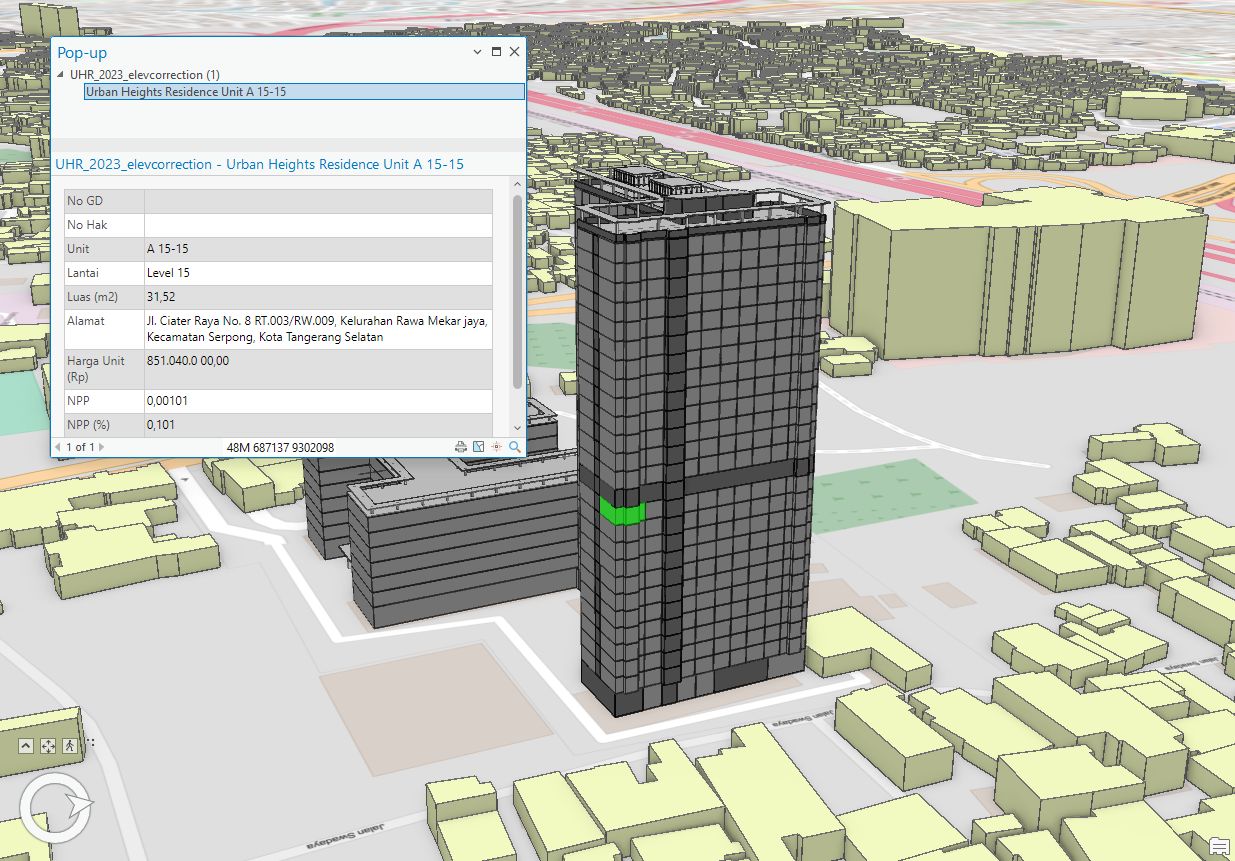
Developed an interactive 3D GIS model for "Urban Heights Residence," bridging the gap between Building Information Modeling (BIM) and geospatial technology. This project transformed static architectural blueprints into a dynamic "Digital Twin," allowing property managers to visualize the building in its geographic context. The system features a granular query engine where users can click on specific 3D units to access real-time attribute data, such as unit pricing, floor area, and occupancy status.
Granular Visibility: Successfully modeled individual apartment units (e.g., Unit A 28-15, Unit A 16-15) with precise spatial accuracy, enabling "room-level" analysis within a city-scale map.
Data-Rich Visualization: Integrated critical business attributes directly into the 3D model, allowing instant retrieval of information like "Unit Price" (Rp 851.040.000), "Floor Area" (31.52 m²), and "NPP" values via interactive pop-ups.
Operational Efficiency: Streamlined property management by replacing spreadsheet-based tracking with a visual 3D interface, facilitating faster decision-making for unit sales and maintenance.
Smart City Implementation: Demonstrated the practical application of 3D GIS for urban density management, aligning with modern Smart City standards for vertical living.
ArcGIS Pro (3D Analyst) / ArcGIS Online (Web Scene) / BIM Data Integration (IFC/Revit to GIS) / 3D Spatial Query / Python / Revit
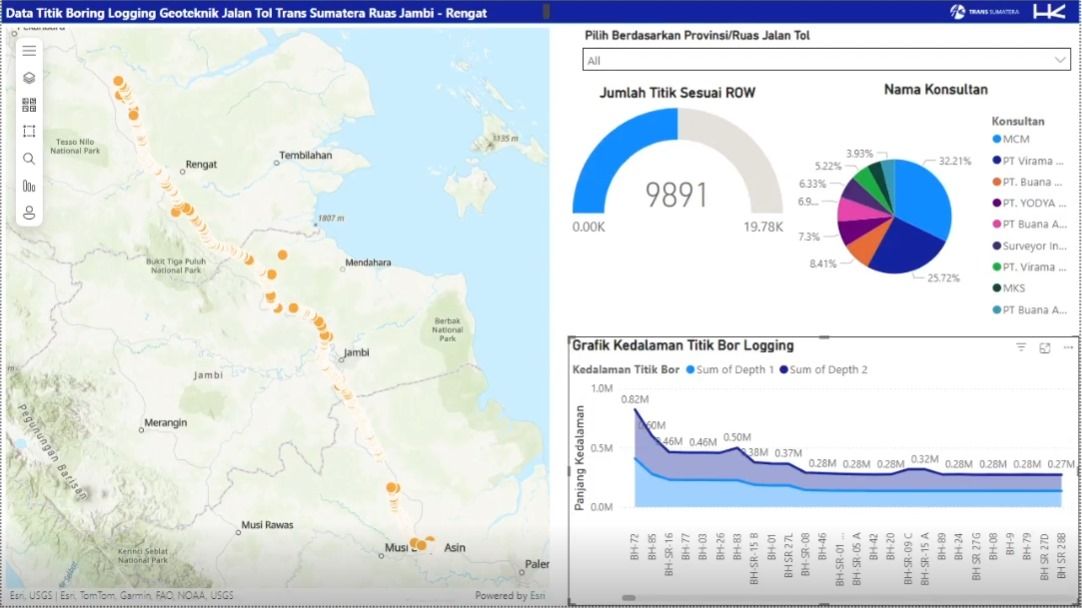
Designed and implemented a suite of analytical dashboards using Power BI to support the construction management of the Trans Sumatra Toll Road (JTTS). The solution integrates complex geotechnical data with spatial visualization to monitor borehole logging progress across the Jambi-Rengat section. Additionally, the system tracks Key Performance Indicators (KPIs) for Building Information Modeling (BIM) implementation, ensuring that engineering consultants meet rigorous project standards.
Spatial-Analytical Integration: Successfully visualized over 9,800 geotechnical borehole points, combining depth metrics with geospatial location to identify soil characteristic trends across different provinces.
Consultant Performance Tracking: Developed comprehensive charts to audit the output of major engineering consultants (e.g., PT Virama Karya, PT Buana), ensuring accountability in borehole logging activities.
BIM Compliance Monitoring: created high-level executive dashboards to track BIM implementation scores against a target of 80 points, providing real-time "Red/Green" status indicators for project sections like Padang-Sicincin and Junction Palembang.
Granular Project Control: Enabled detailed parameter tracking (e.g., Geometry, 3D Model Clash Analysis) on a month-to-month basis, allowing project managers to pinpoint bottlenecks in the design phase.
Microsoft Power BI / ArcGIS for Power BI (Integration) / DAX (Data Analysis Expressions) / BIM (Building Information Modeling) Data Standards / SQL
2023 · Sumatra, Indonesia (PT Hutama Karya Projects)
High-Performance WebGIS for Trans Sumatra Toll Road Planning
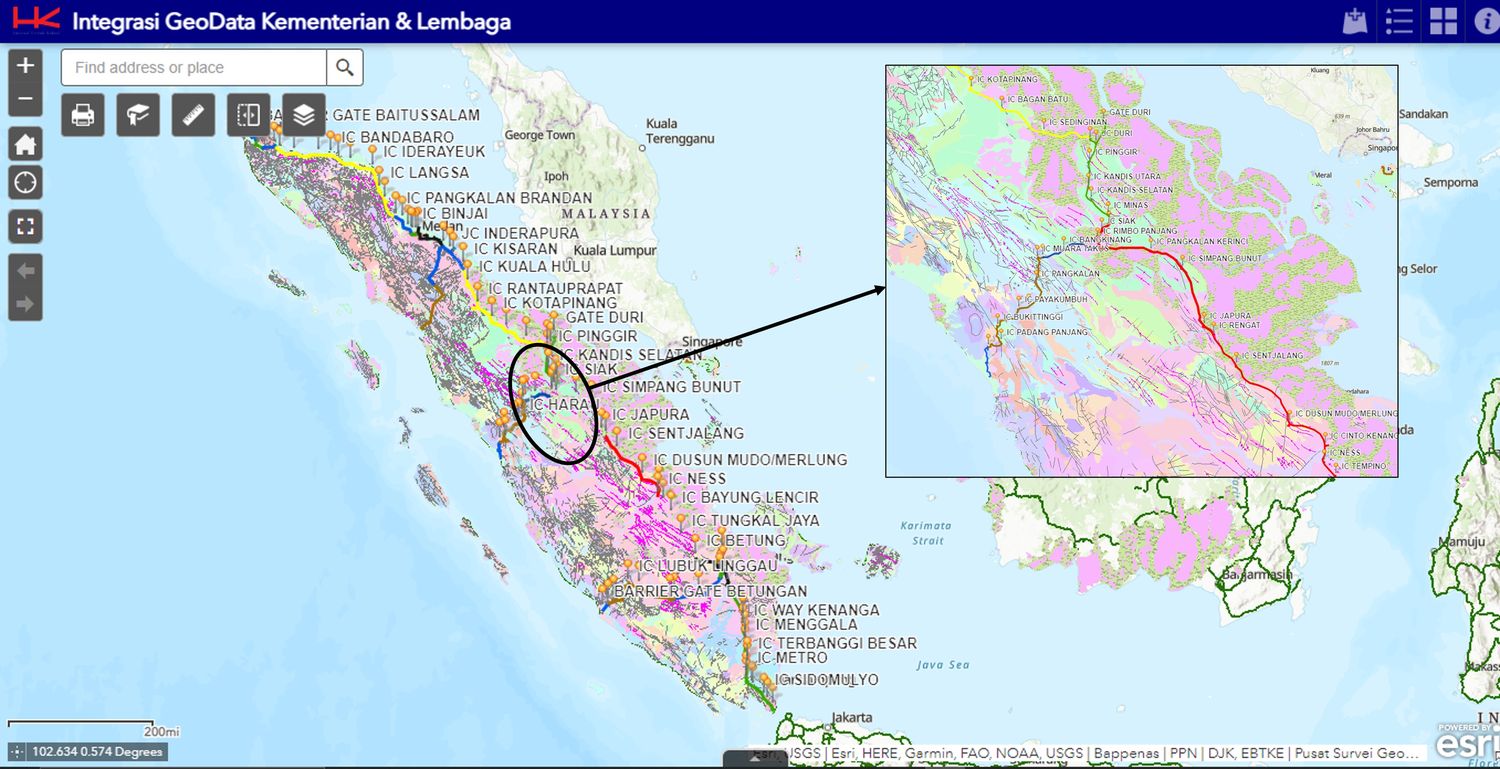
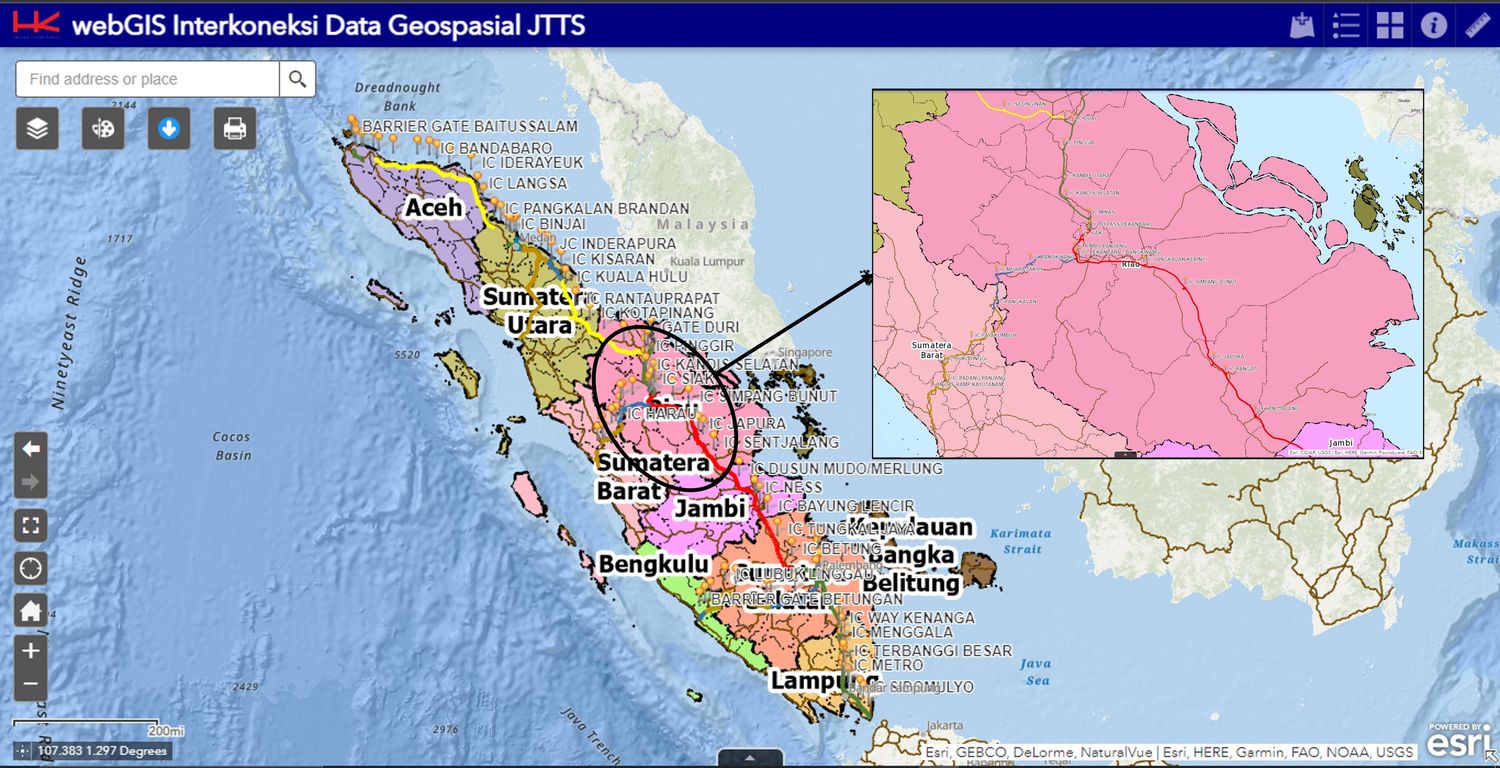
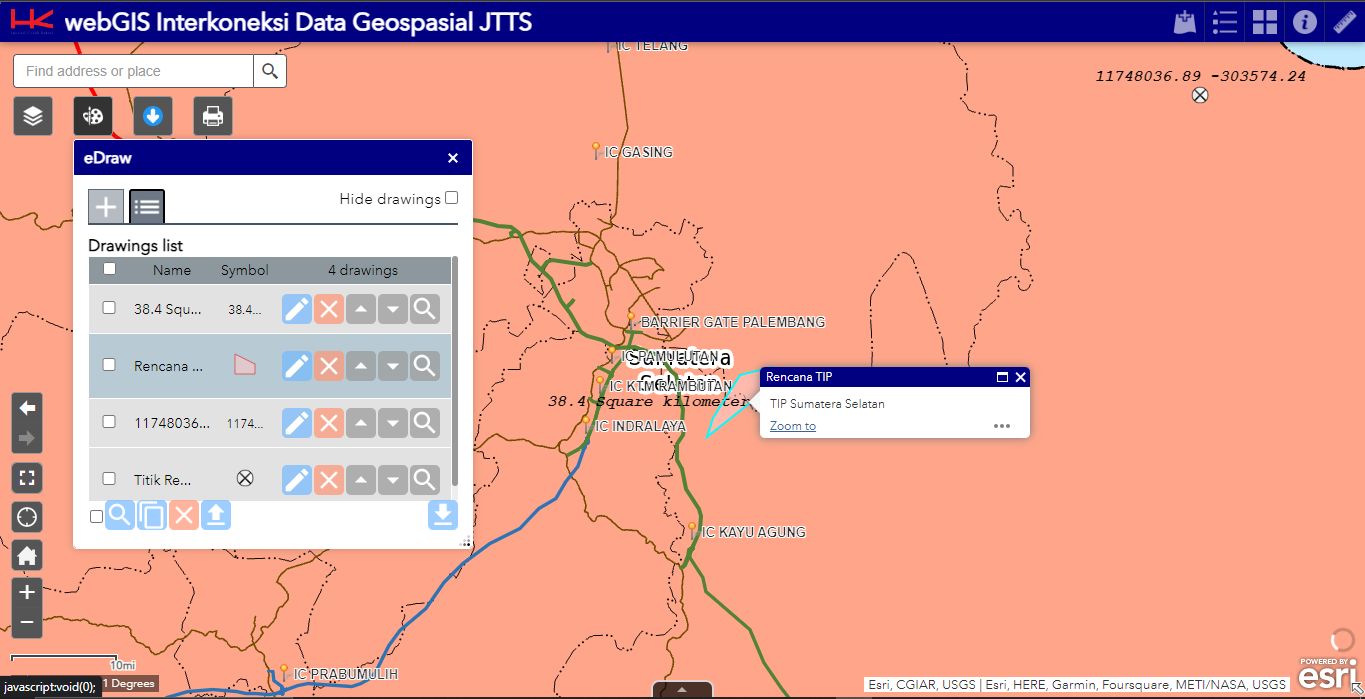
Engineered an optimized WebGIS application for PT Hutama Karya (Persero) to streamline the planning and visualization of the Trans Sumatra Toll Road (JTTS) megaproject. Addressing critical performance bottlenecks, I re-architected the spatial data delivery using Web Map Service (WMS) standards and developed custom functional widgets. The solution replaced a sluggish legacy system with a high-speed, interactive platform used for strategic route planning and asset management.
Extreme Performance Boost: Achieved a 94% reduction in data loading time, optimizing the application response from over 3 minutes down to just 12 seconds.
User Satisfaction: Validated the system's usability with a System Usability Scale (SUS) score of 70 (Good/Acceptable) from internal engineer testing.
Visual Clarity: Overhauled the visualization of complex interchange and route data, improving legibility for decision-makers.
Custom Widget Suite: Developed three proprietary widgets tailored to user needs
eDraw: An enhanced drawing tool allowing engineers to annotate routes and export/import marking data.
Smart Downloader: Enabling users to download vector data (Shapefile/DWG) based on specific Areas of Interest (AOI).
Custom Print: Automated map layout generation conforming to Hutama Karya’s official cartographic standards.
ArcGIS Web AppBuilder / ArcGIS Enterprise / ArcGIS Server / Javascript / Web Map Service / Geospatial Database (GDB)
Integrated Disaster Management System for Mount Merapi
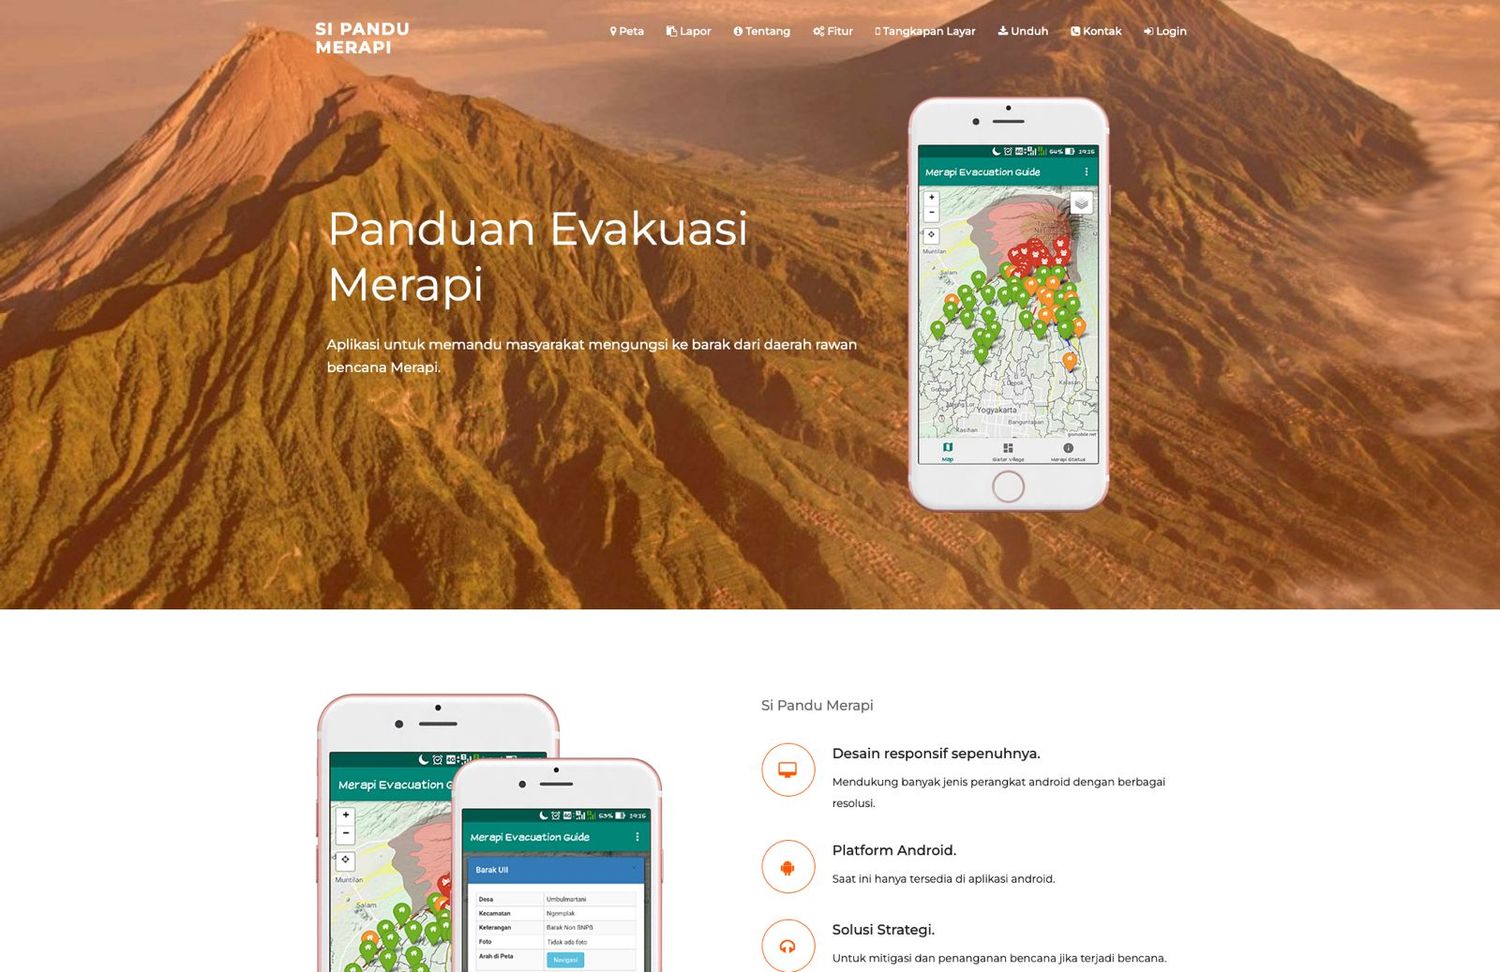
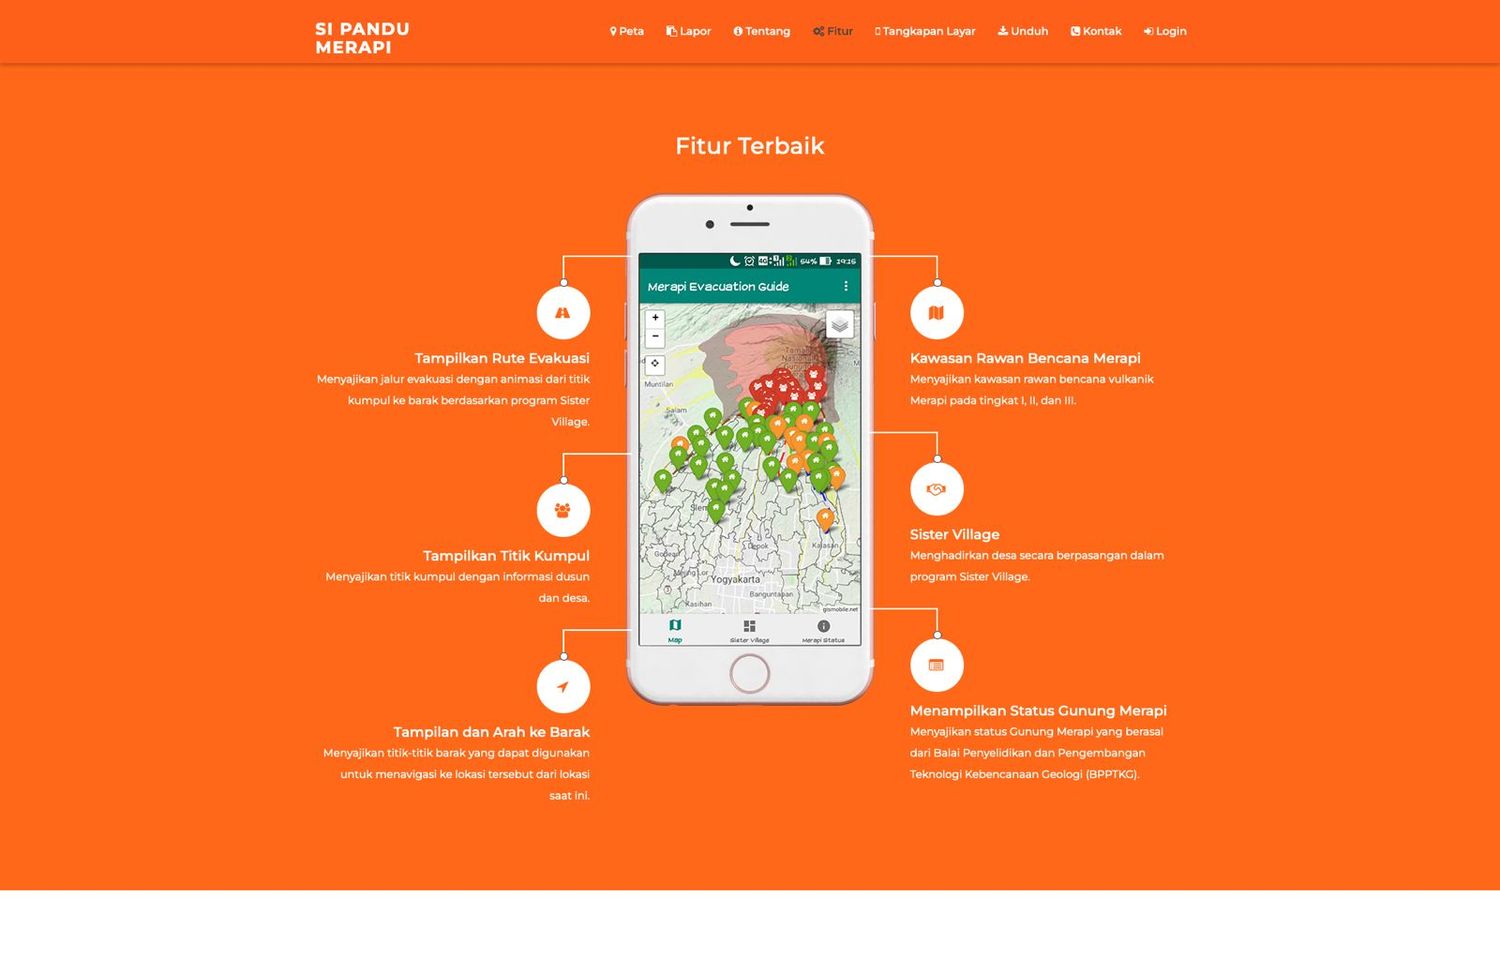
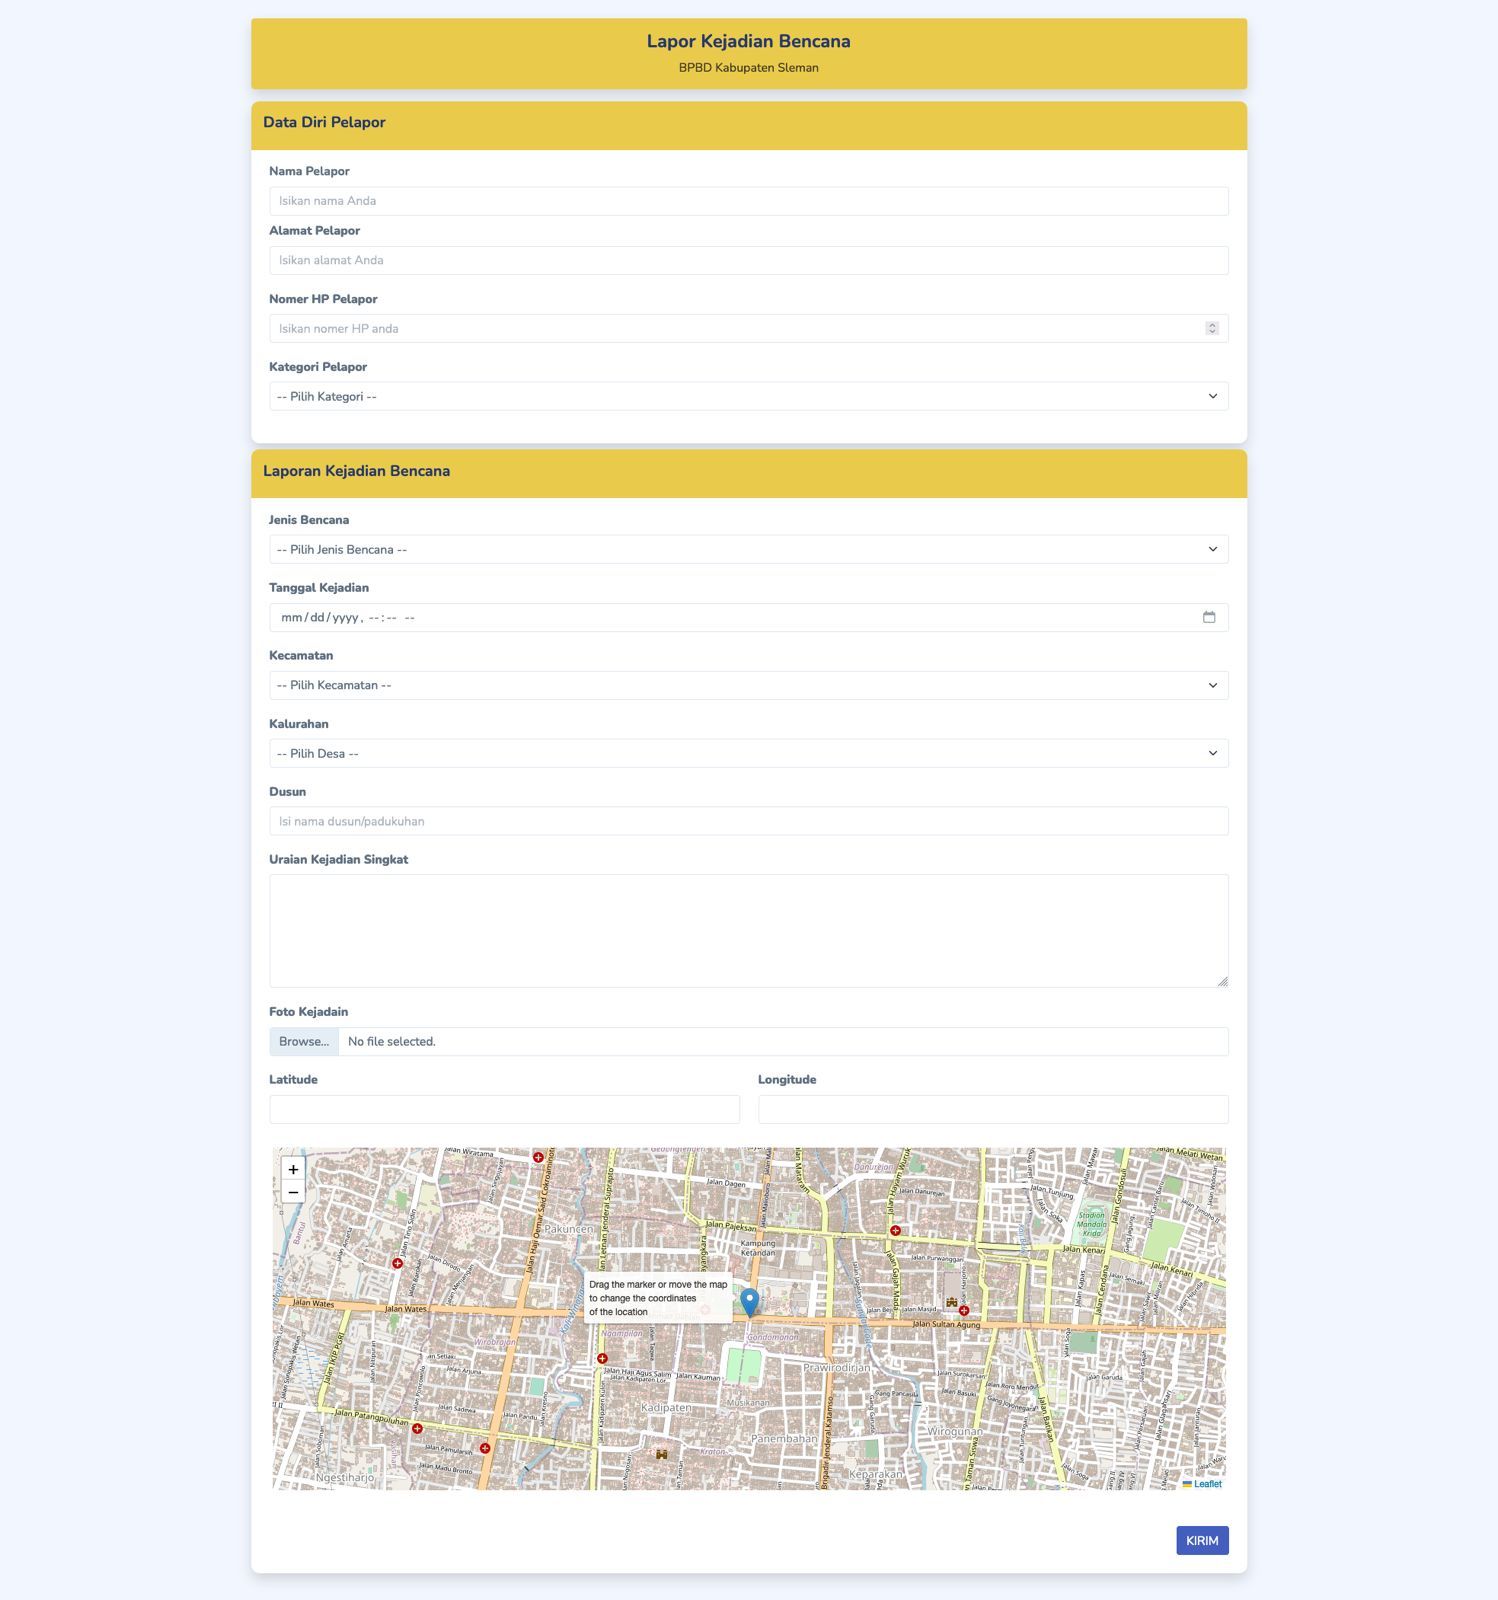
Led the enhancement of SiPandu Merapi, the official disaster response ecosystem for the Sleman Regional Disaster Management Agency (BPBD). The project bridged the gap between public safety and digital technology by developing a dual-interface system: a robust Web Admin Dashboard for operators to manage evacuation logic, and a user-centric Mobile Application empowering residents to report volcanic activity in real-time.
Crowdsourced Intelligence: Engineered a "Report" feature allowing tourists and residents to submit real-time updates on disaster events and social preparedness activities directly from the field.
Centralized Command: Built a comprehensive Admin Web Interface for BPBD operators to validate data and manage critical information like refugee logistics and shelter availability.
Life-Saving Navigation: Integrated interactive maps featuring "Sister Village" pairings and evacuation routes, guiding users safely from Disaster-Prone Areas (KRB) to designated assembly points.
Real-Time Sync: Established seamless synchronization between the mobile frontend and the command center database, ensuring zero-latency information flow during critical emergencies.
2021 · Cibinong, Indonesia (Badan Informasi Geospasial)
National Boundary Information System (Sitaswil)
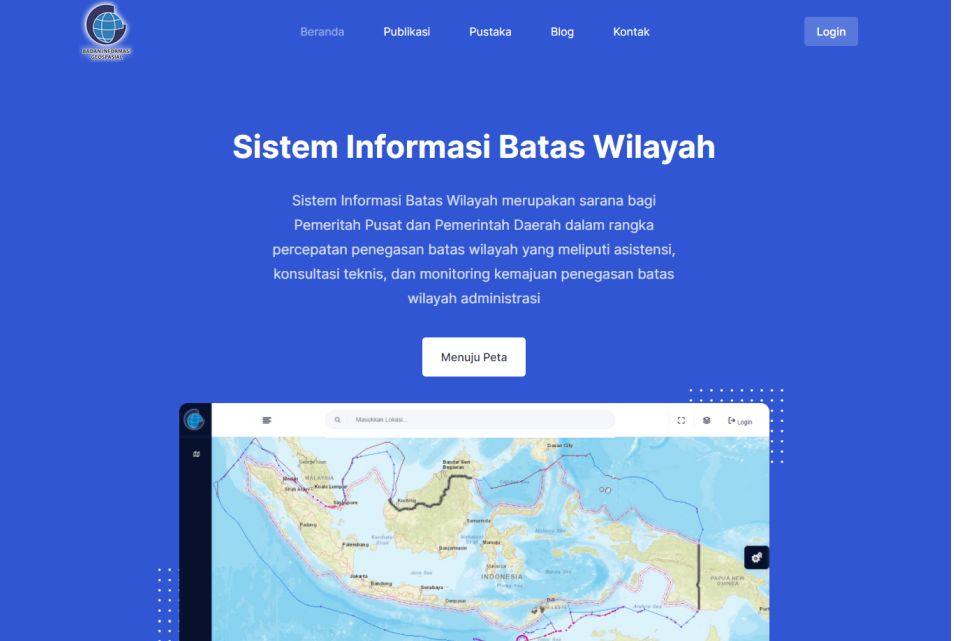
Contributed to the modernization of Sitaswil, the official boundary information system for the Indonesian Geospatial Information Agency (BIG). The project focused on enhancing the accessibility and security of administrative boundary data for central and regional governments. Key deliverables included a complete redesign of the landing page for better user engagement, the integration of advanced geocoding features, and the implementation of strict data security protocols tailored for government stakeholders.
UX/UI Modernization: Revamped the platform’s landing page and user interface, significantly improving visual appeal and user navigation flow.
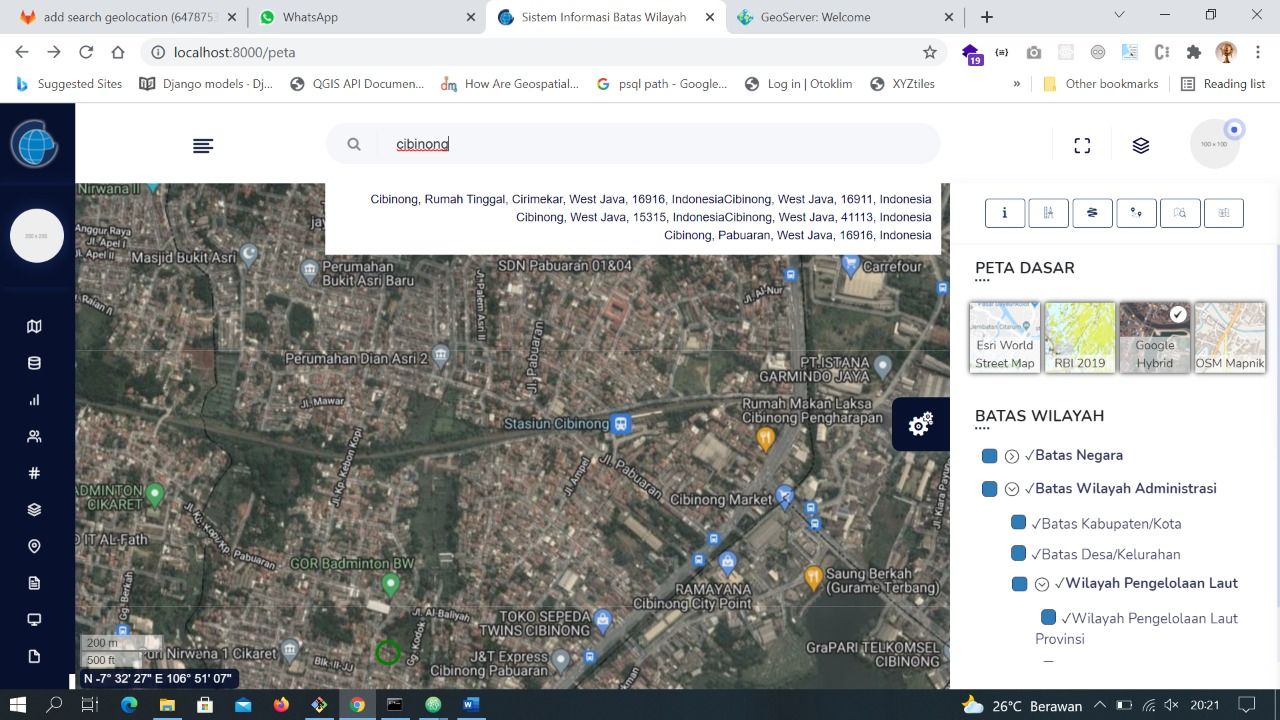
Enhanced Searchability: Integrated the Nominatim API to enable precise geocoding, allowing users to search and locate administrative regions efficiently.
Secure Data Access: Engineered a Role-Based Access Control (RBAC) system to ensure secure, ministry-specific access to sensitive geospatial data.
System Optimization: Refined existing web features to reduce latency and improve the overall stability of the boundary mapping services.
Python / PostgreSQL / Geoserver / OSM Nominatim API / Leaflet.js / PostGIS / HTML5/CSS3 / PHP / Laravel
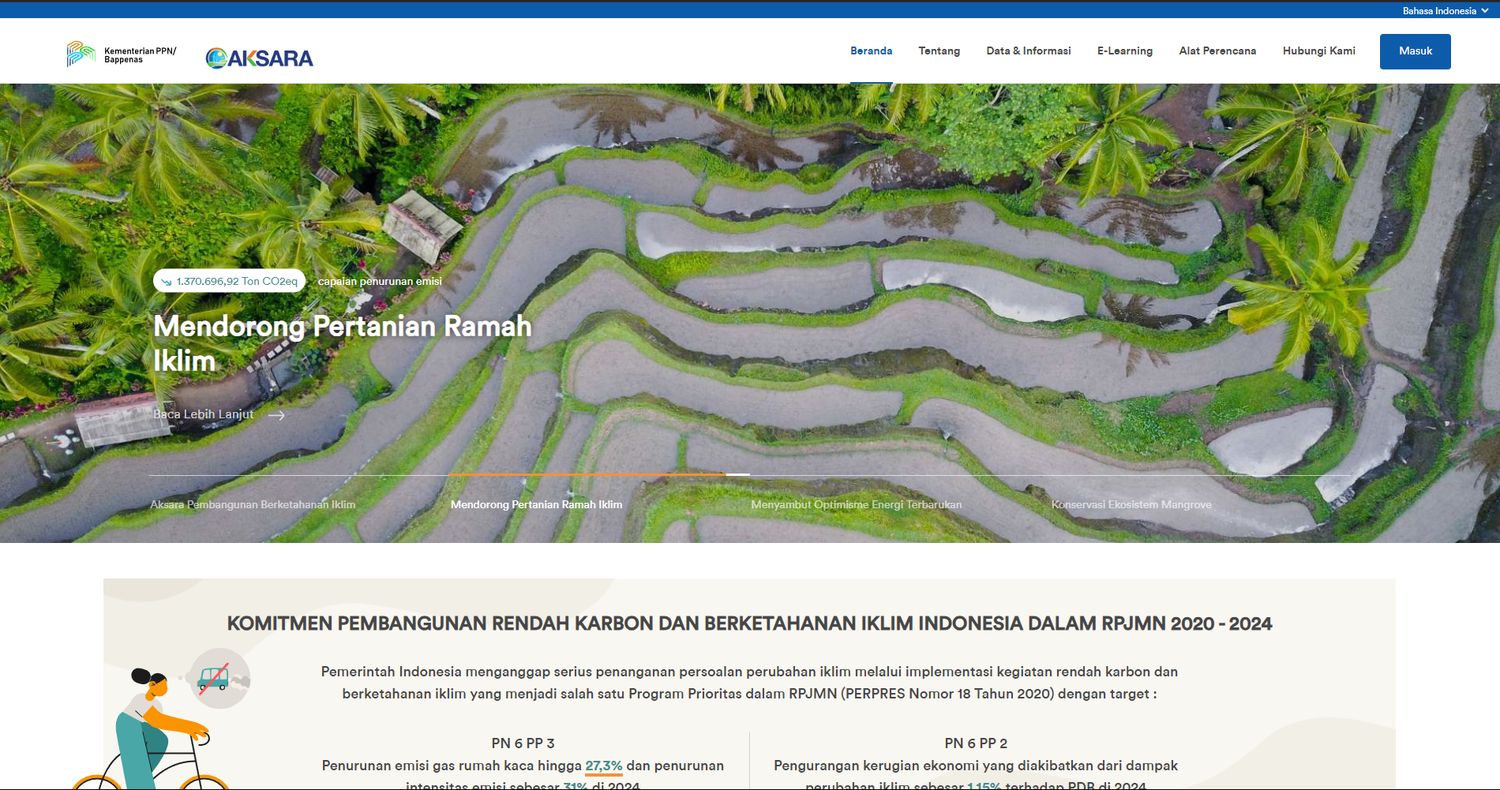
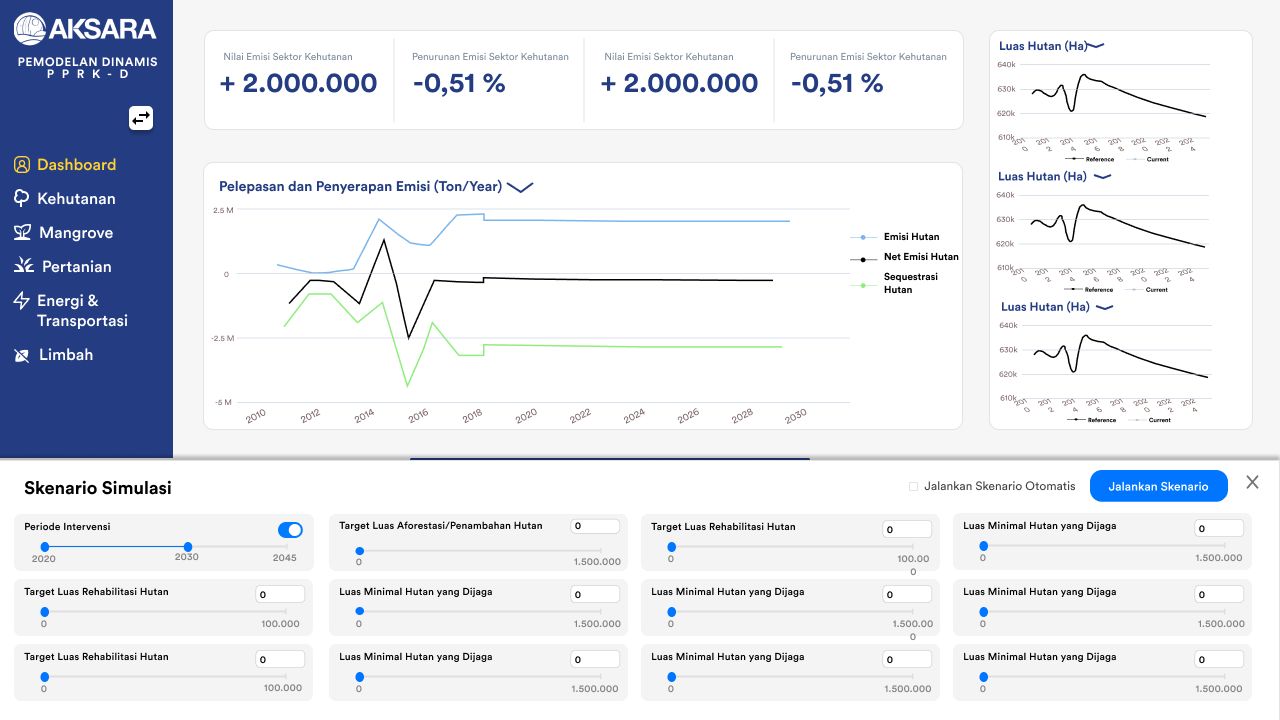
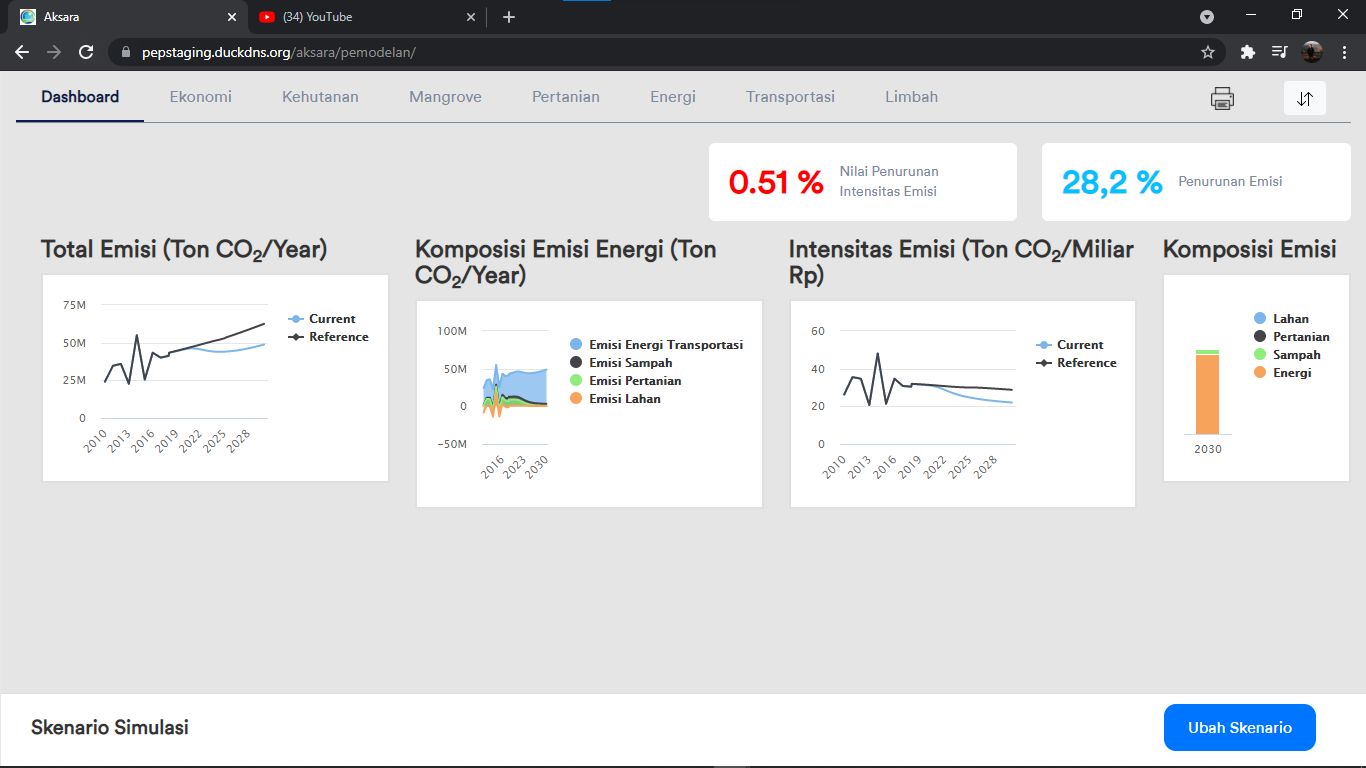
Led the comprehensive UI/UX redesign of the AKSARA WebGIS platform to address usability challenges and modernize the user experience. Leveraging Figma, I conducted a visual audit of the legacy interface and engineered a new, intuitive design system. The overhaul transformed a text-heavy interface into a clean, dashboard-style layout with improved visual hierarchy, making complex climate data simulation tools accessible to non-technical stakeholders.
Enhanced Usability: Re-architected the navigation flow, moving from a scattered top-menu structure to a consolidated sidebar for faster access to key modules.
Visual Clarity: Introduced a coherent color scheme and card-based layout to distinguish between data visualization metrics and simulation controls clearly.
Simulation Experience: Redesigned the "Simulation Scenario" controls (sliders and toggles) to be more interactive and user-friendly, reducing the learning curve for government officials.
Client Satisfaction: Delivered a high-fidelity prototype that aligned perfectly with client objectives, bridging the gap between complex backend logic and frontend presentation.
Figma / UI/UX Design Principles / Data Visualization Design / User Flow Analysis
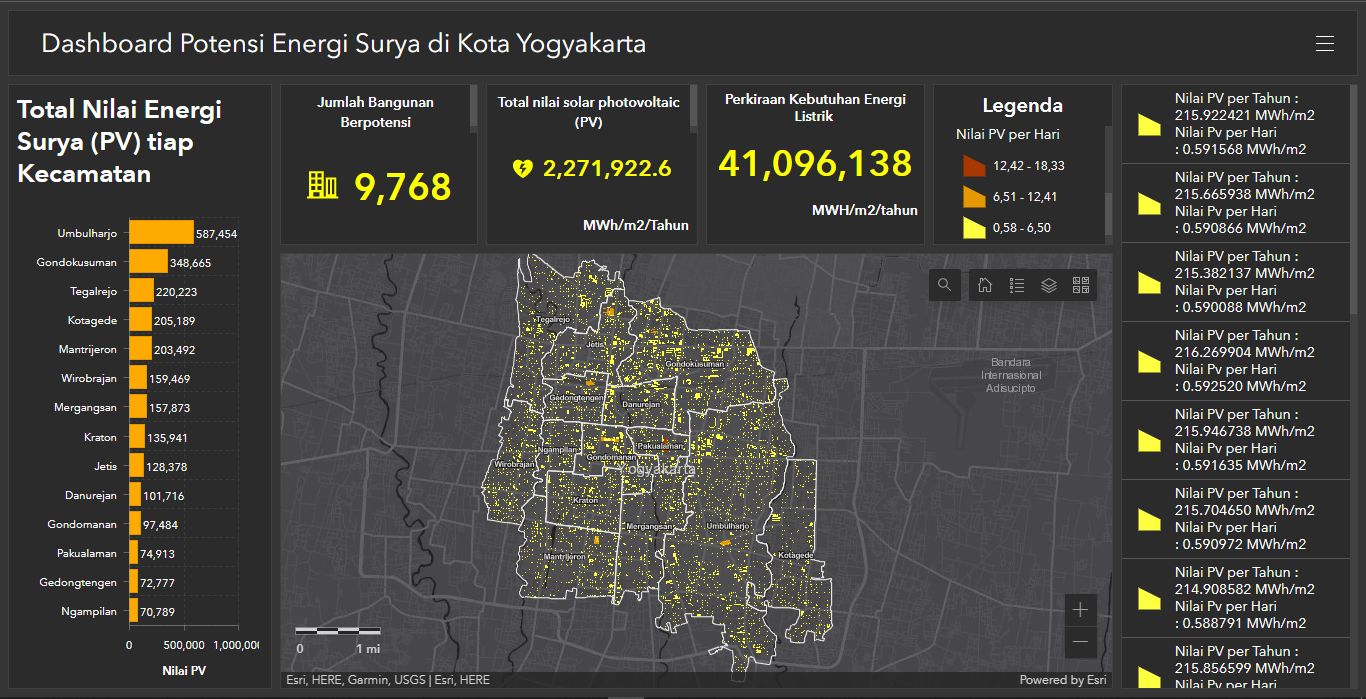
Developed a high-precision spatial analysis dashboard to map and quantify solar energy potential across Yogyakarta City. By integrating solar radiation data with building footprint layers, the system calculates the Photovoltaic (PV) potential for individual structures. This tool empowers city planners and stakeholders to identify high-yield zones for renewable energy adoption, supporting Yogyakarta's transition toward a sustainable smart city.
Granular Precision: Successfully analyzed and mapped solar potential for over 9,700 buildings, providing granular data down to the individual rooftop level.
Data-Driven Insight: Quantified a total solar photovoltaic potential of over 2.2 million MWh/m²/year, contrasting it against estimated electrical demand to highlight sustainability gaps.
Strategic Zoning: Identified "Umbulharjo" as the district with the highest solar energy potential, allowing policymakers to target specific areas for pilot projects.
Interactive Decision Support: Delivered a dark-mode, user-friendly dashboard that allows non-technical users to filter data by district and view specific building metrics instantly.
ArcGIS Dashboard / ArcGIS Pro / ArcPy / Data Visualization / Solar Radiation Analysis
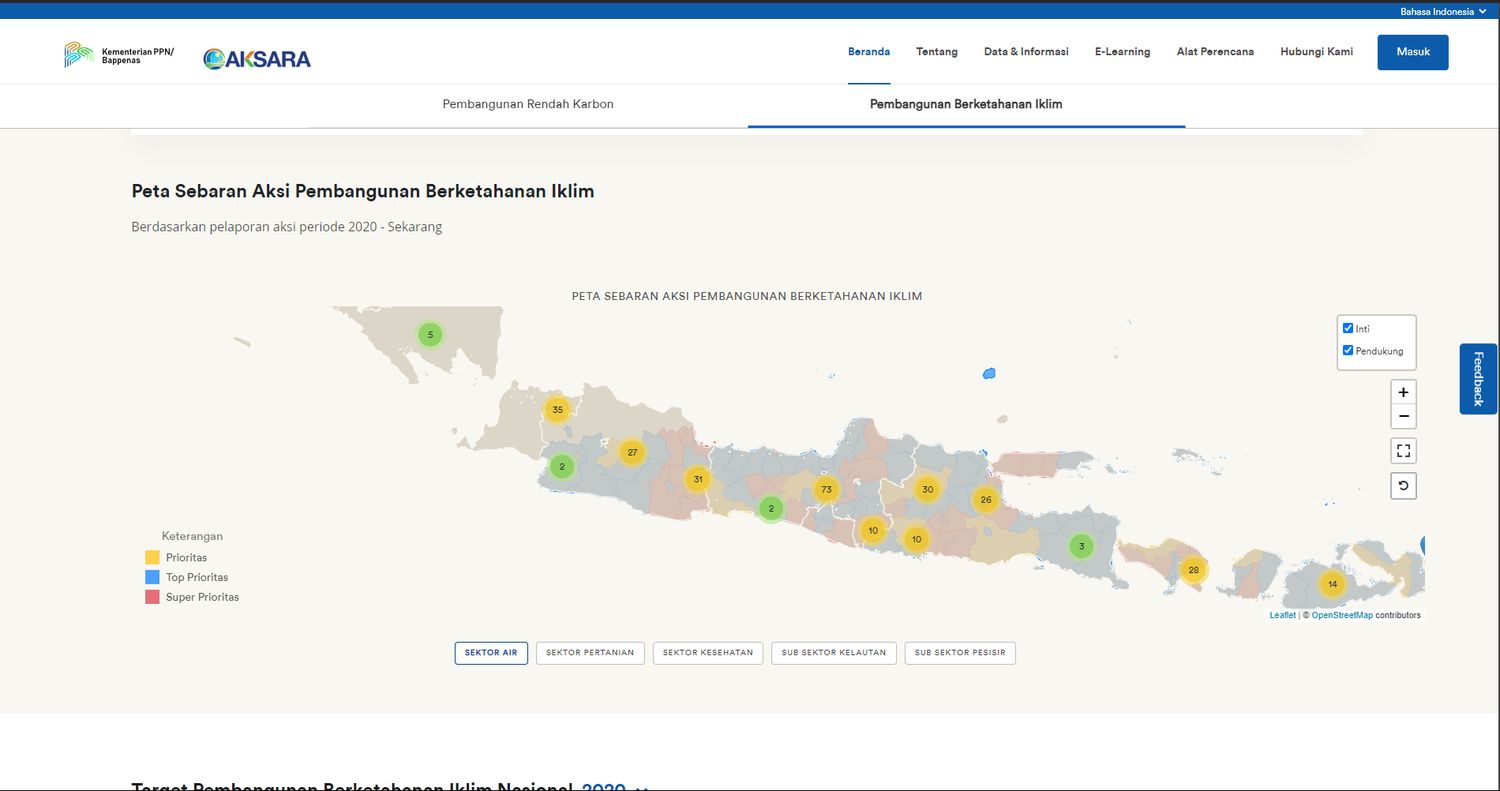
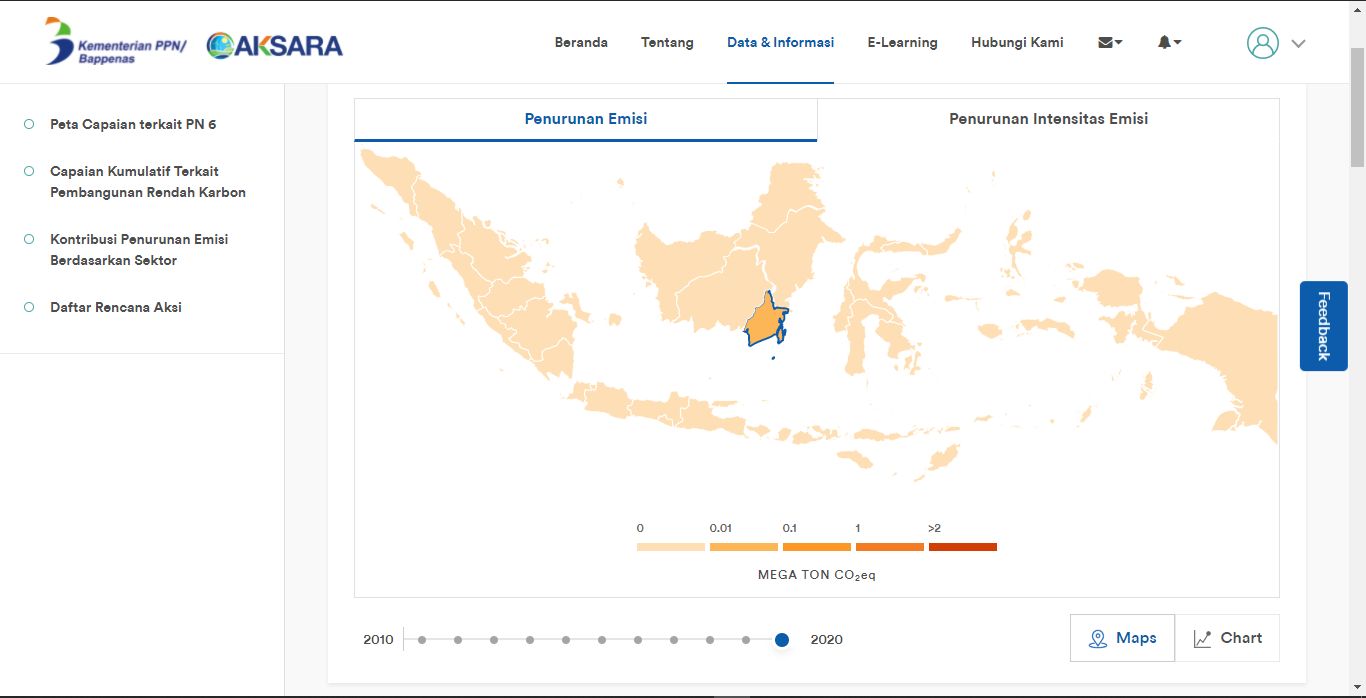
Spearheaded the backend development for the Climate Resilience module of the AKSARA platform, a strategic initiative by the Indonesian Ministry of National Development Planning (Bappenas). Engineered a robust interactive data collection system using Python Django and PostgreSQL, enabling seamless input, management, and geospatial analysis of national climate action data. The solution bridges complex database schemas with user-friendly interfaces to support national-level decision-making.
Digital Transformation: Digitized the reporting process for Climate Resilience actions, replacing manual workflows with a streamlined interactive form system.
API Architecture: Developed high-performance REST APIs to serve complex geospatial data to the frontend map interface efficiently.
Data Integrity: Designed a custom database schema in PostgreSQL to ensure accurate capture and validation of multi-dimensional climate data.
National Scale: Supported the monitoring of national development targets (RPJMN) regarding Low Carbon and Climate Resilience development.