Work.

Geospatial tools, mapping systems and work in the field. Choose a project to explore its context, architecture, and evidence.

TRAYEK, project illustration
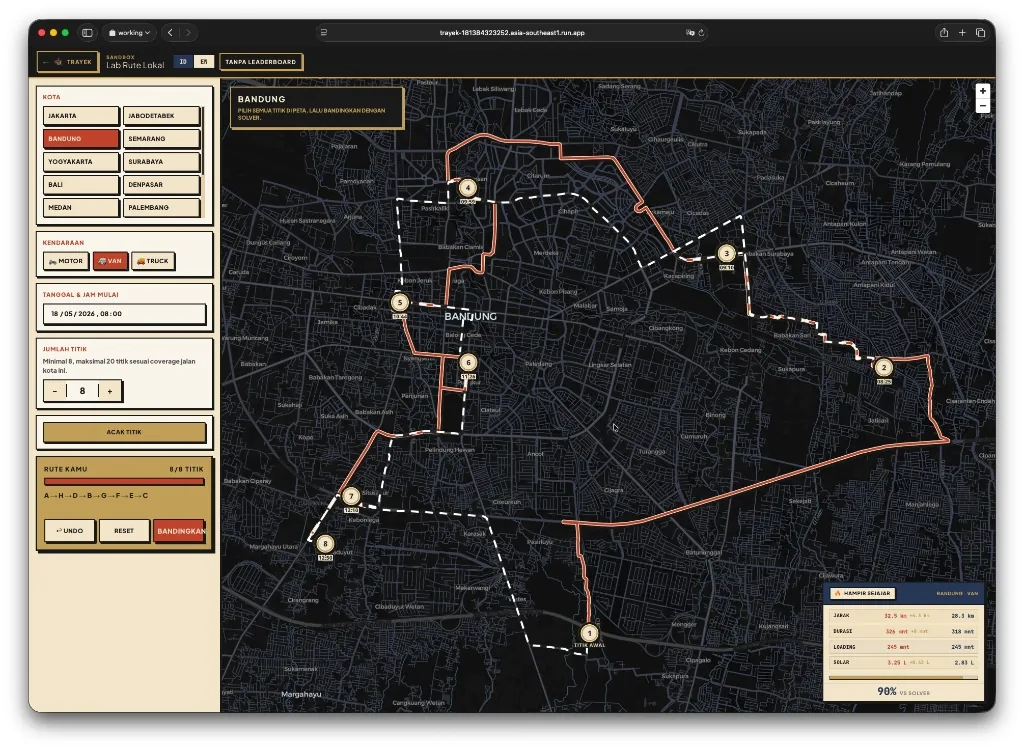
TRAYEK Landing page: Pemilihan kota & armada logistik Nusantara (Truk, Box, Motor, Drone).
Routing & mobility 2026 · Bandung & Nusantara, Indonesia

TRAYEK

Indonesian Routing Optimization Game. Player vs Valhalla & AI routing solver featuring authentic local constraints: odd-even plates, tidal floods, prayer breaks, and the Nusantara corridor. Built with Next.js 16, Go, and Valhalla. Top 100 #JuaraVibeCoding 2026.

Next.js 16Go (Golang)ValhallaMapLibre GLTypeScriptVertex AIFirestoreGoogle Cloud Run

16 projects available

Indonesian Routing Optimization Game. Player vs Valhalla & AI routing solver featuring authentic local constraints: odd-even plates, tidal floods, prayer breaks, and the Nusantara corridor. Built with Next.js 16, Go, and Valhalla. Top 100 #JuaraVibeCoding 2026.

Next.js 16Go (Golang)ValhallaMapLibre GL

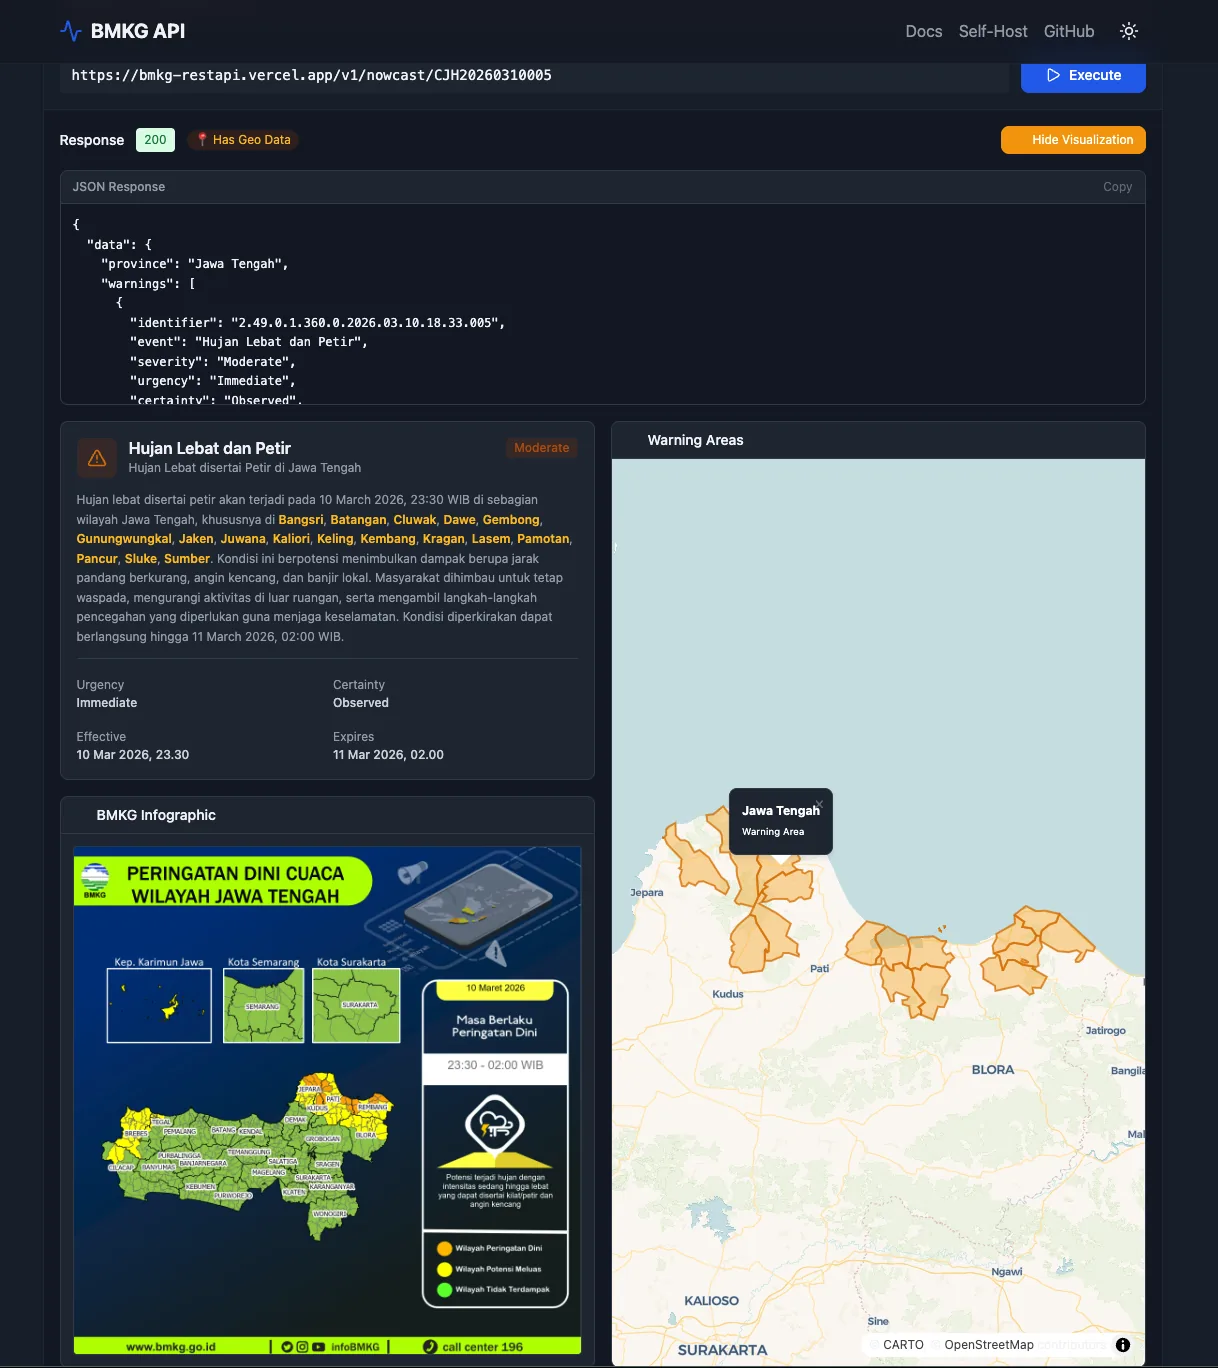
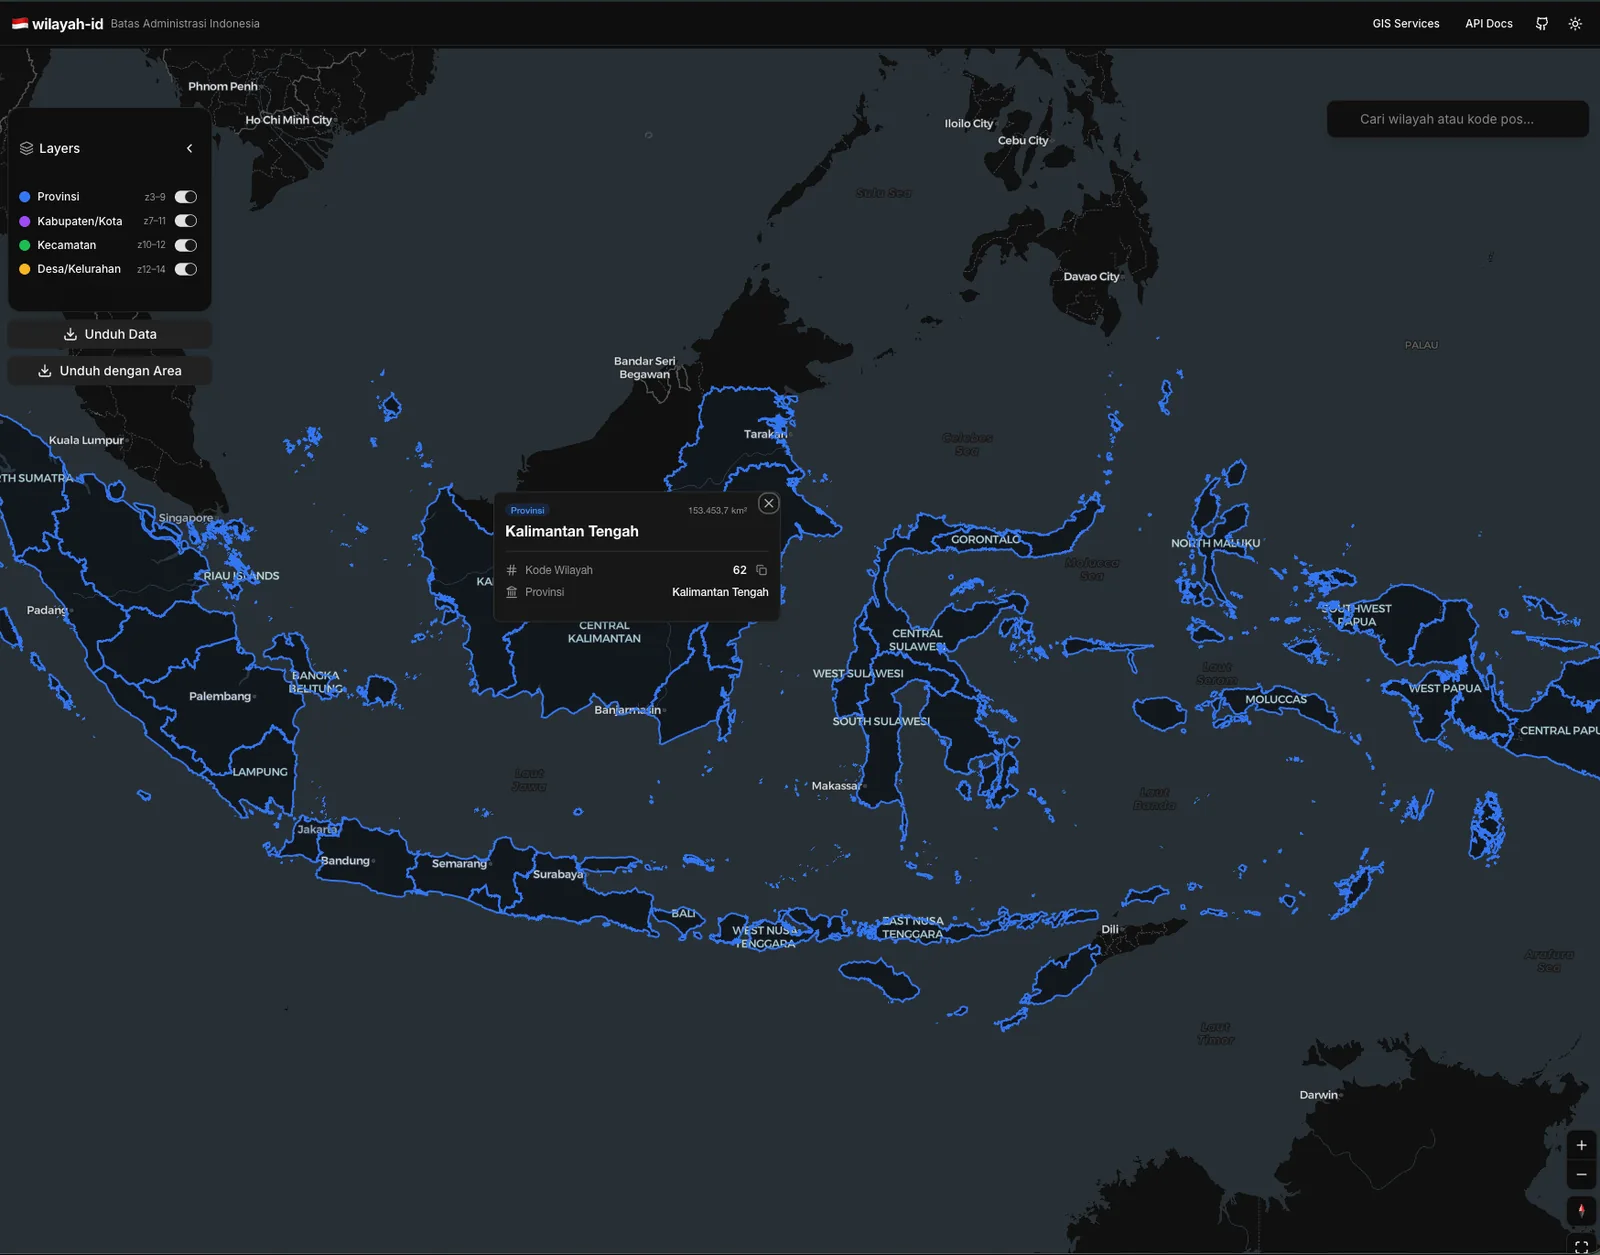
Developed a modern RESTful API wrapper for the Indonesian Agency for Meteorology, Climatology, and Geophysics (BMKG) open data. This project seamlessly converts legacy XML weather and earthquake data into developer-friendly JSON format. It features a robust Model Context Protocol (MCP) integration, allowing AI agents to natively query real-time Indonesian weather forecasts and seismic activity. The service is optimized for edge deployment on Vercel.

REST APIJSON/XML ParsingModel Context Protocol (MCP)Vercel

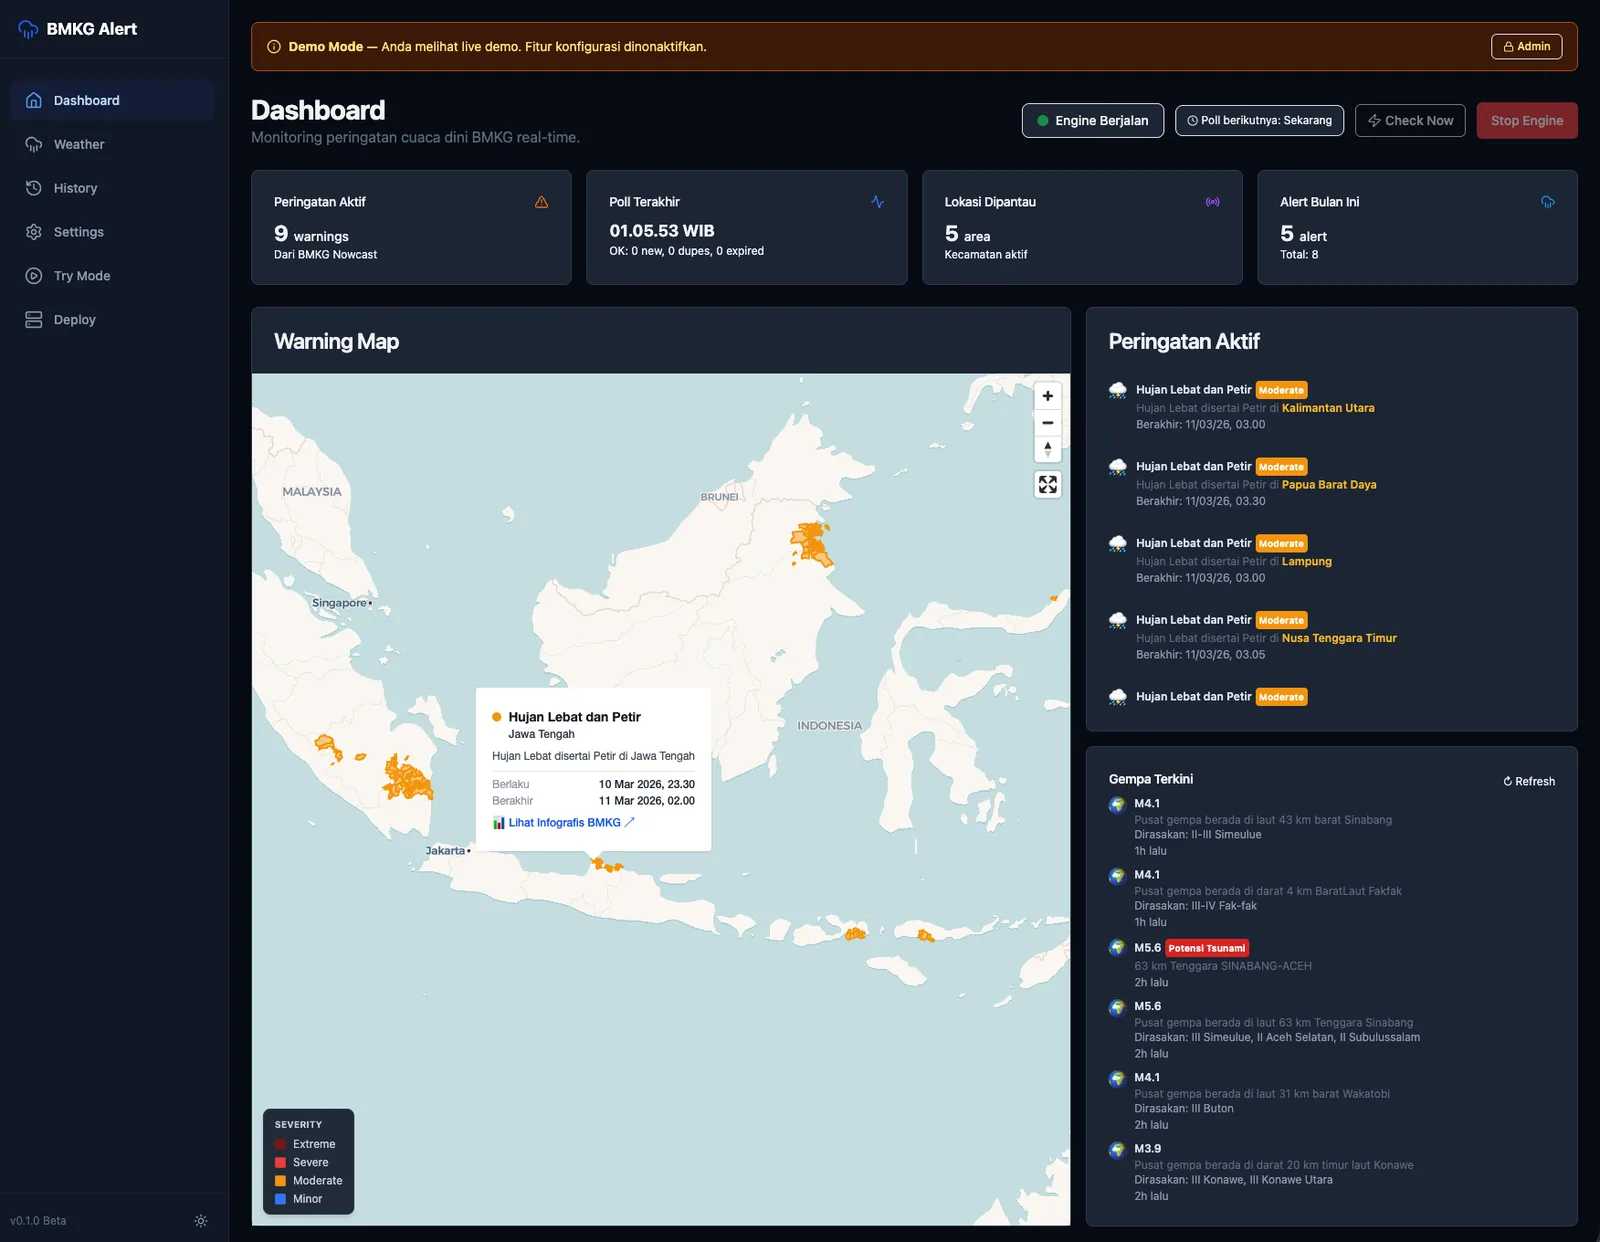
A real-time alerting service designed to monitor the BMKG API and dispatch instant notifications for significant weather events and earthquakes across Indonesia. The system continuously polls the data feeds and pushes formatted alerts to external messaging platforms via webhooks whenever predefined risk thresholds are met. Fully containerized with Docker for easy self-hosted deployment.

AstroDockerWebhooksAPI Integration

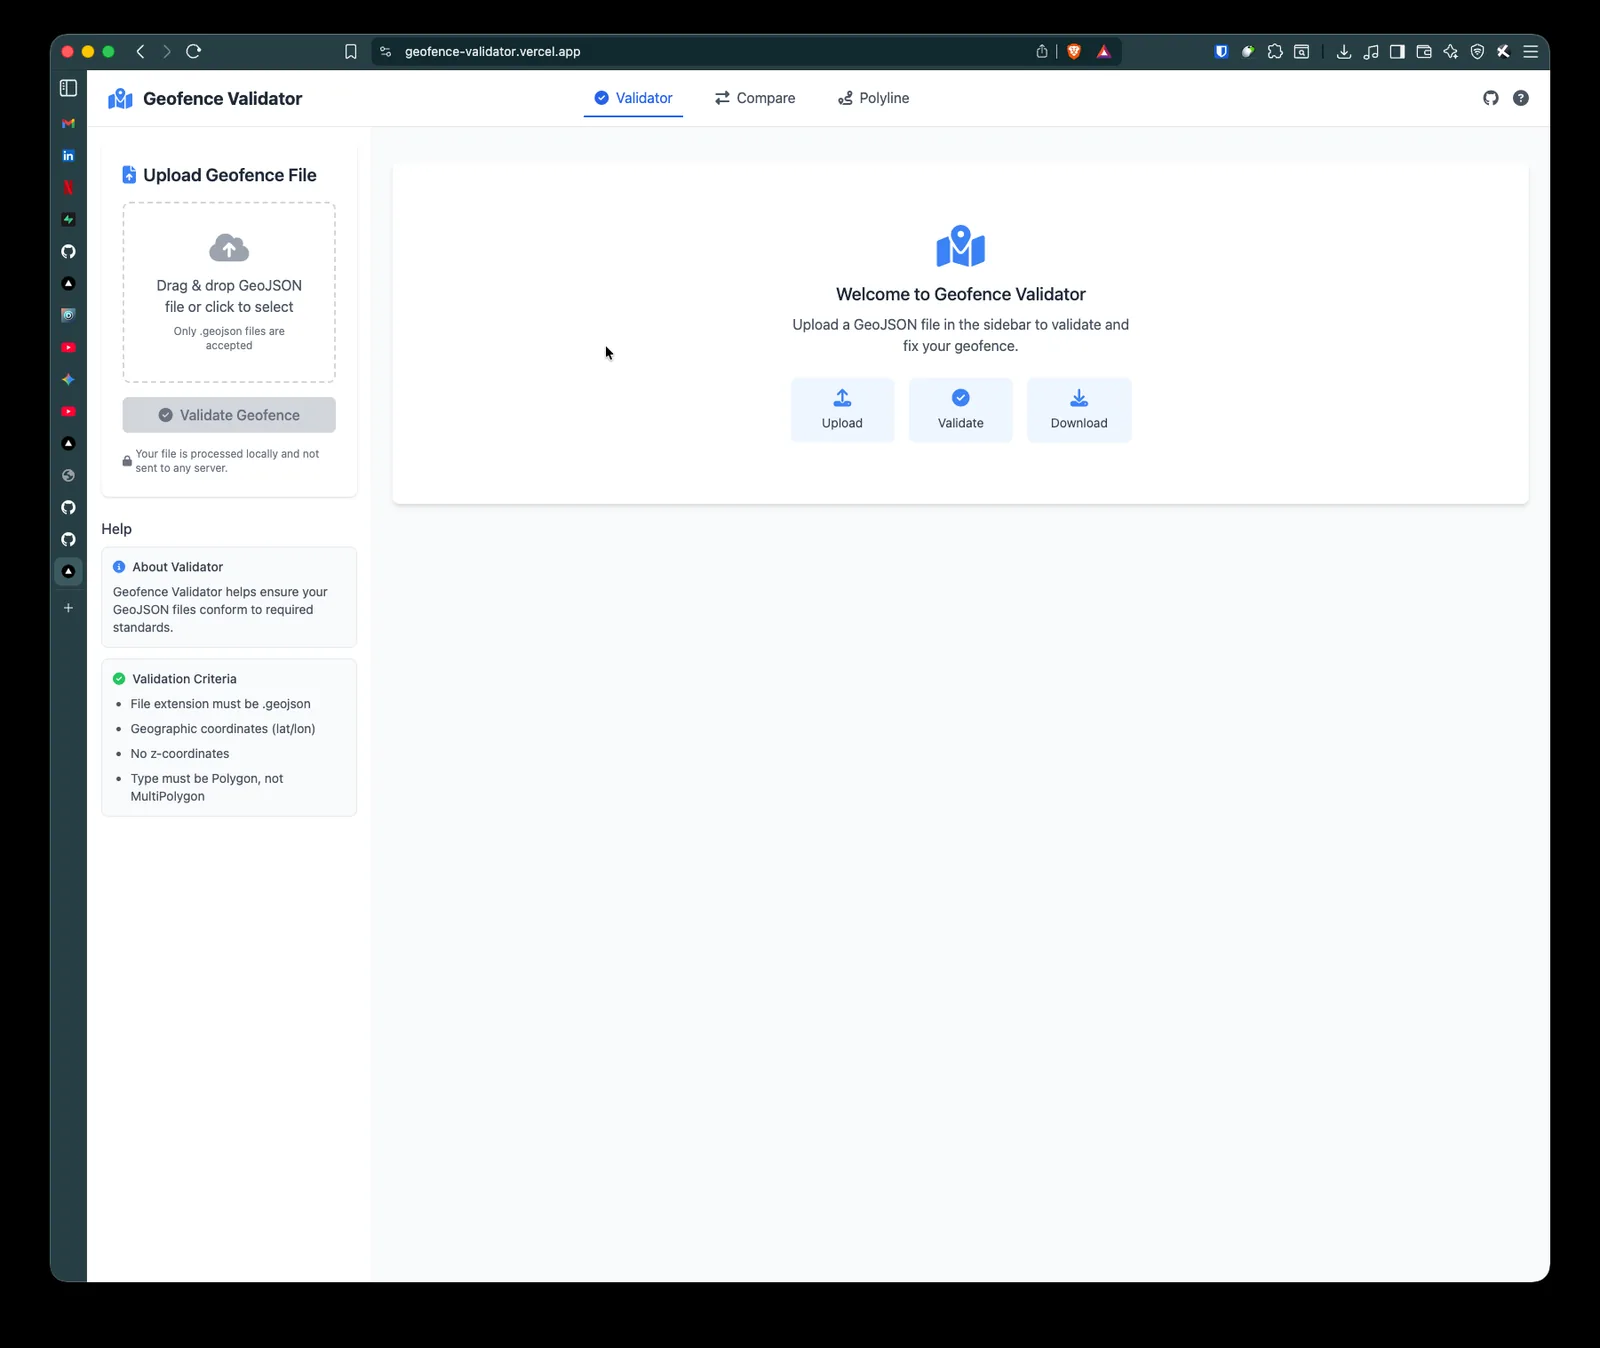
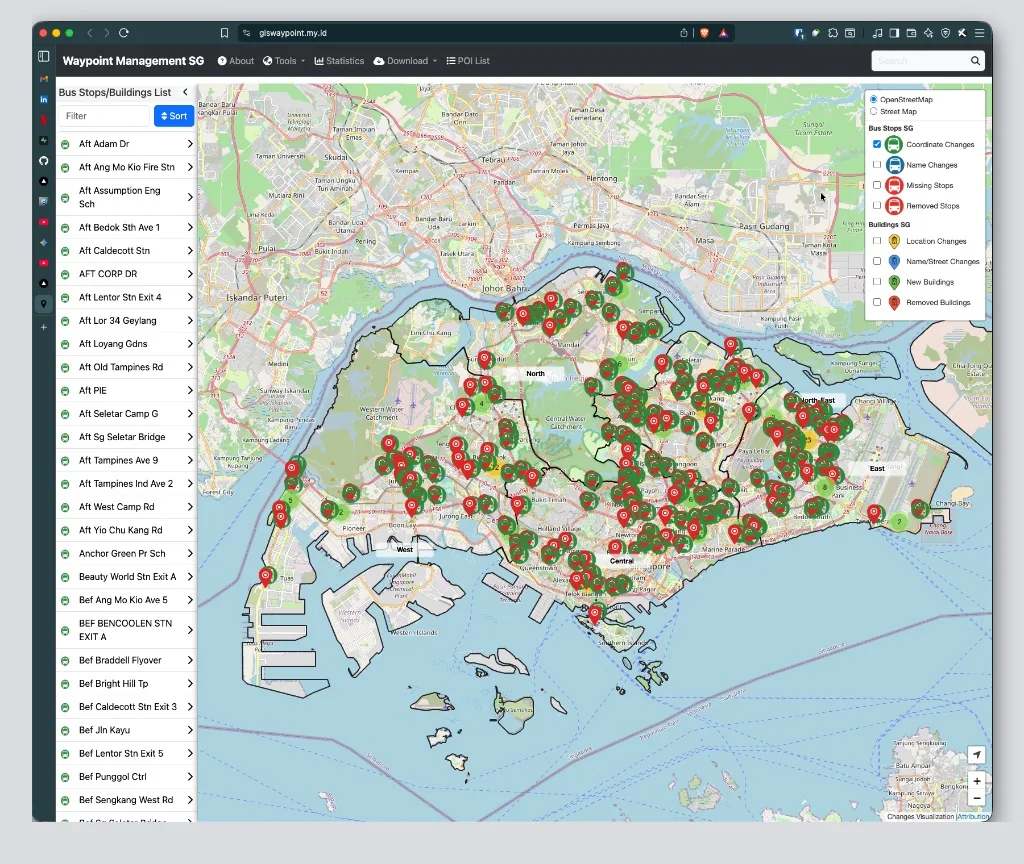
Developed a specialized geospatial intelligence tool to validate and visualize changes in Singapore's public transport infrastructure (SGERP database). This web application serves as a "Change Detection System," automatically identifying discrepancies such as shifted bus stop coordinates, renamed stations, and missing assets. By implementing the Haversine formula, the system calculates precise displacement distances, visualizing the movement of assets with dynamic connectors to aid urban planners in data verification.

Leaflet.js (Cluster & Layer Control)Bootstrap 5 (Responsive UI)JavaScript (Typeahead.js, List.js)Haversine Formula (Geospatial Math)

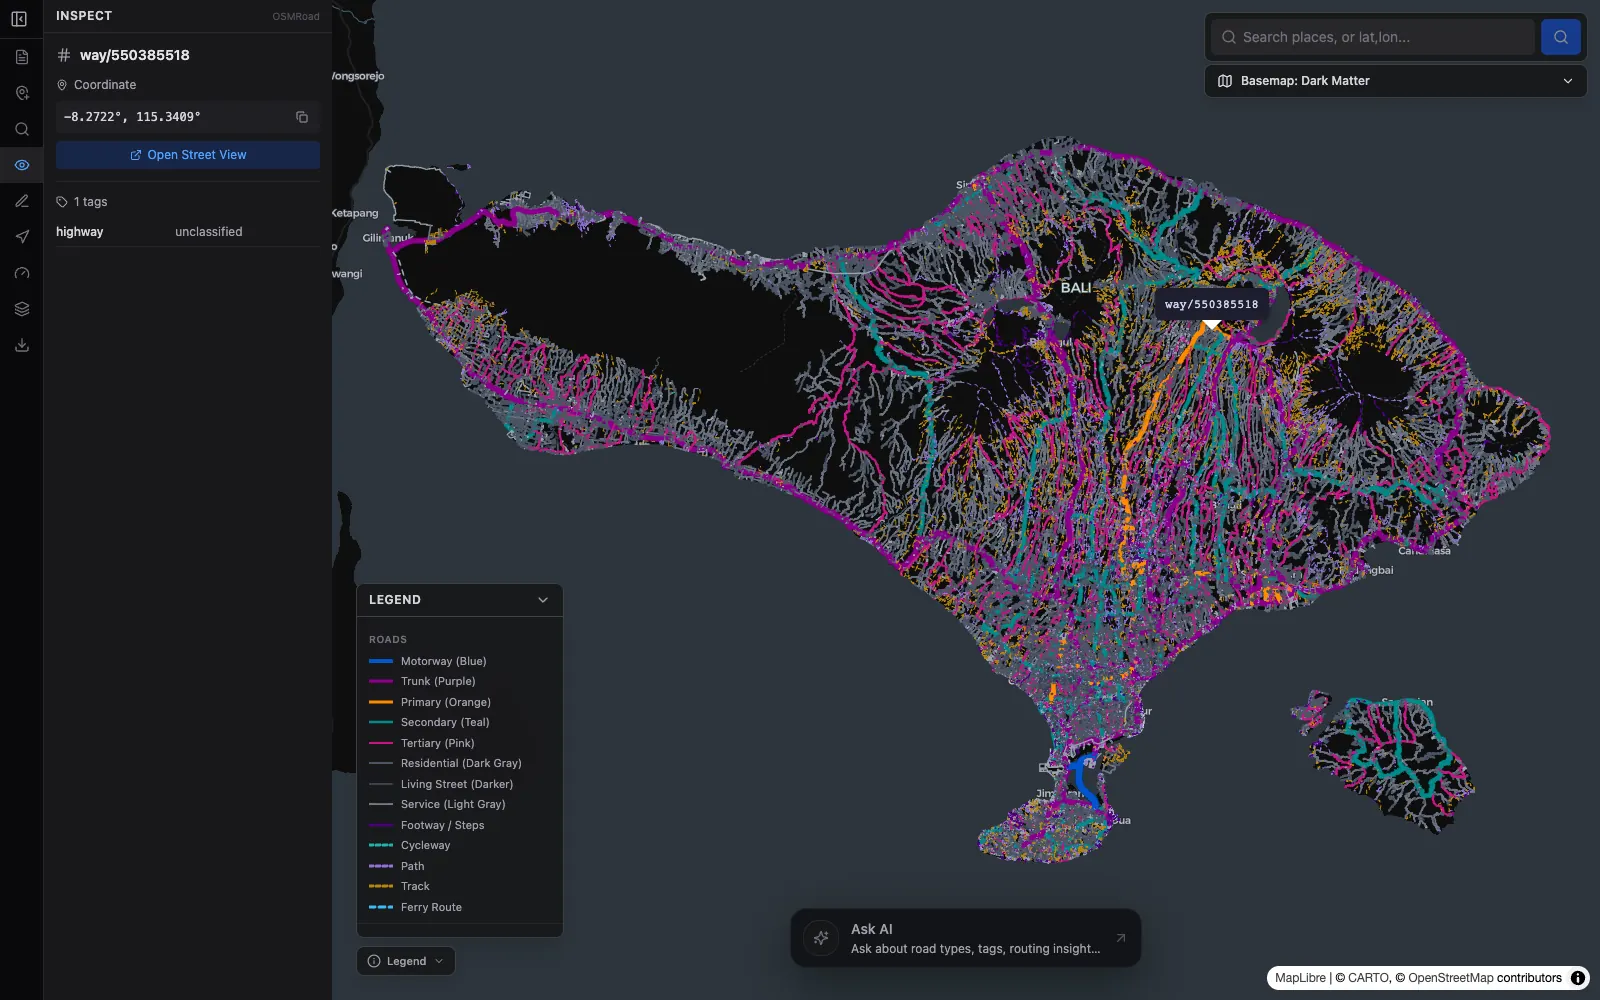
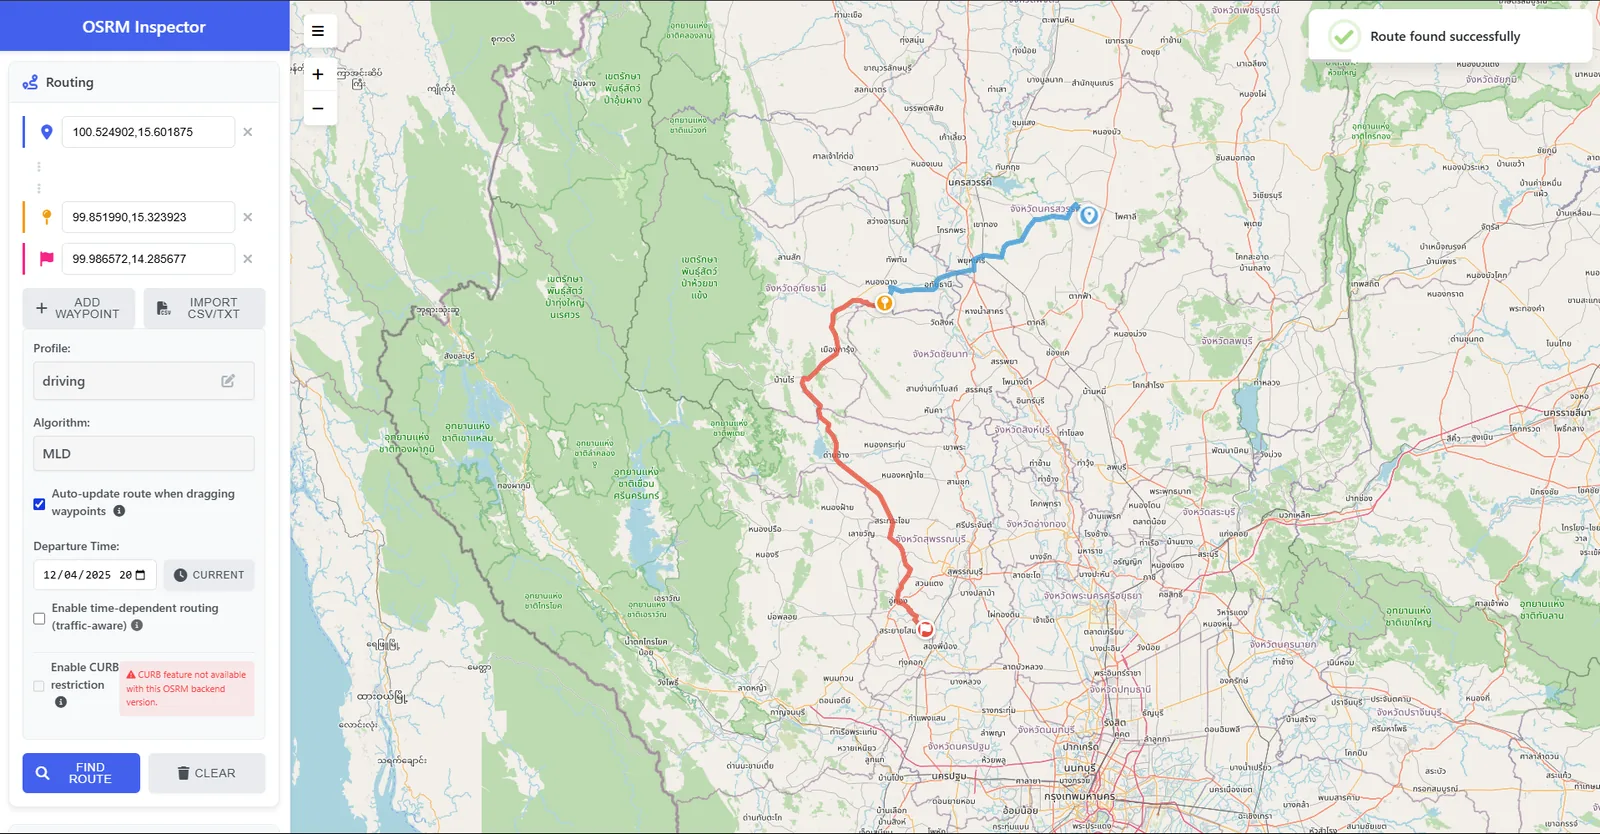
A closer look at the route. Tools for exploring road graphs, debugging routing responses, and inspecting line segments.

Docker & Docker Compose (Containerization)Nginx (Reverse Proxy & Caching)OSRM API (Backend Integration)JavaScript (Leaflet.js & SweetAlert2)

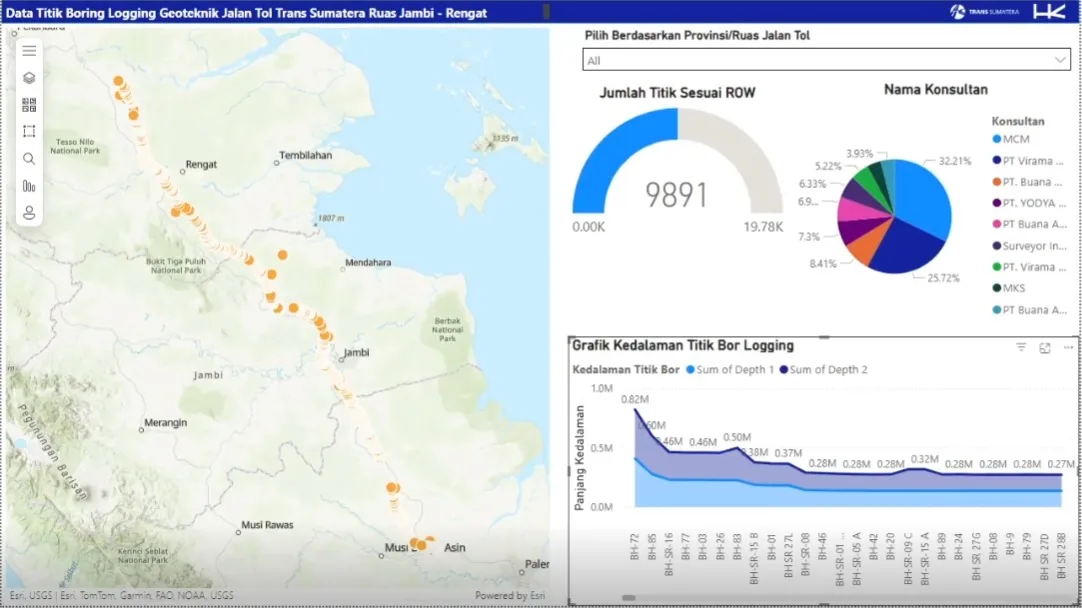
Designed and implemented a suite of analytical dashboards using Power BI to support the construction management of the Trans Sumatra Toll Road (JTTS). The solution integrates complex geotechnical data with spatial visualization to monitor borehole logging progress across the Jambi-Rengat section. Additionally, the system tracks Key Performance Indicators (KPIs) for Building Information Modeling (BIM) implementation, ensuring that engineering consultants meet rigorous project standards.

Microsoft Power BIArcGIS for Power BI (Integration)DAX (Data Analysis Expressions)BIM (Building Information Modeling) Data Standards

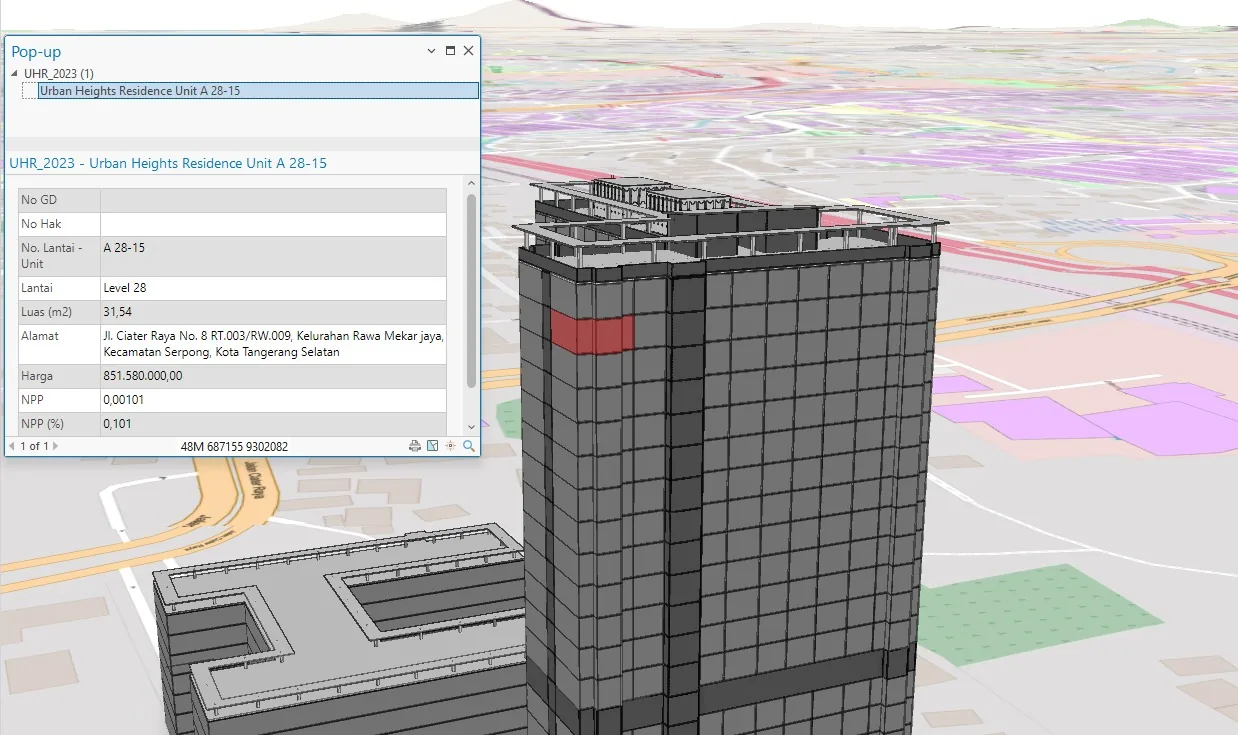
Developed an interactive 3D GIS model for "Urban Heights Residence," bridging the gap between Building Information Modeling (BIM) and geospatial technology. This project transformed static architectural blueprints into a dynamic "Digital Twin," allowing property managers to visualize the building in its geographic context. The system features a granular query engine where users can click on specific 3D units to access real-time attribute data, such as unit pricing, floor area, and occupancy status.

ArcGIS Pro (3D Analyst)ArcGIS Online (Web Scene)BIM Data Integration (IFC/Revit to GIS)3D Spatial Query

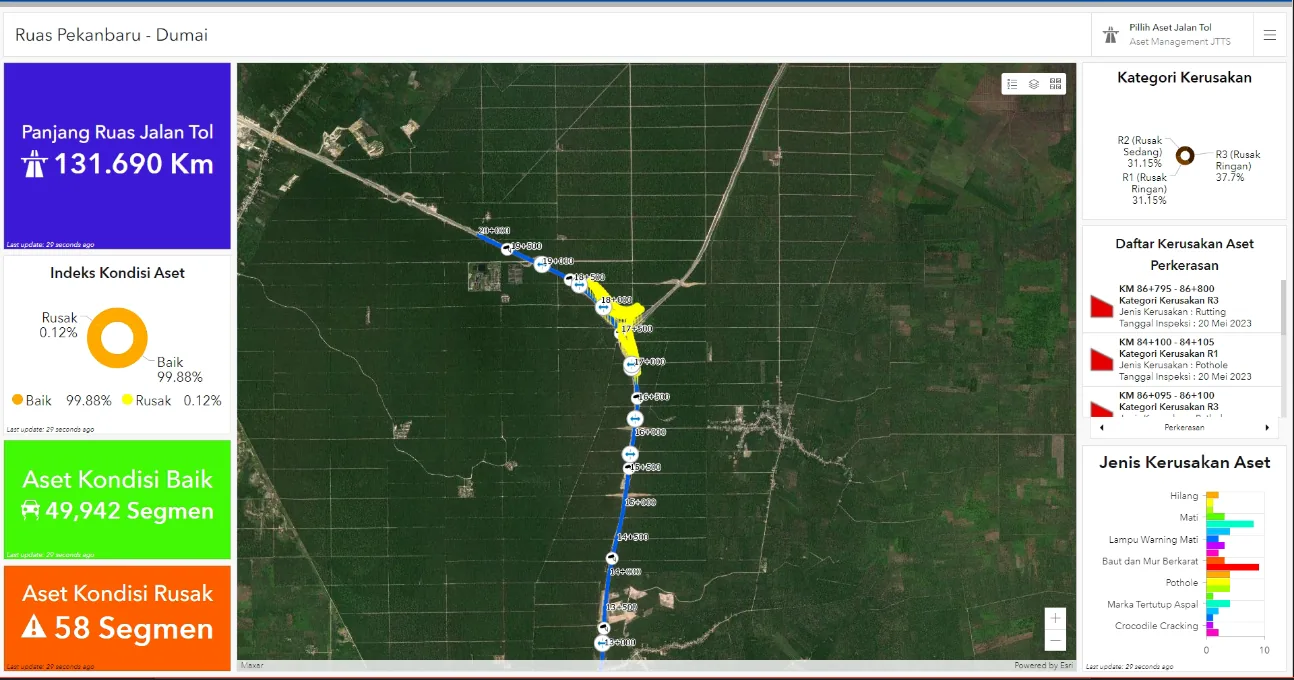
Architected a comprehensive Asset Management Dashboard for PT Hutama Karya (Persero) to digitize the maintenance lifecycle of the Trans Sumatra Toll Road. By integrating ArcGIS Enterprise with LiDAR and UAV survey data, the system creates a "Digital Twin" of the toll road infrastructure. This platform replaces manual reporting with real-time analytics, allowing engineers to track pavement conditions, identify damage types (e.g., potholes, rutting), and prioritize maintenance budgets based on precise geospatial evidence.

ArcGIS EnterpriseLiDAR & UAV Data Integration (3D Terrain Models)Python (Automated Data Processing)Operations Dashboard for ArcGIS

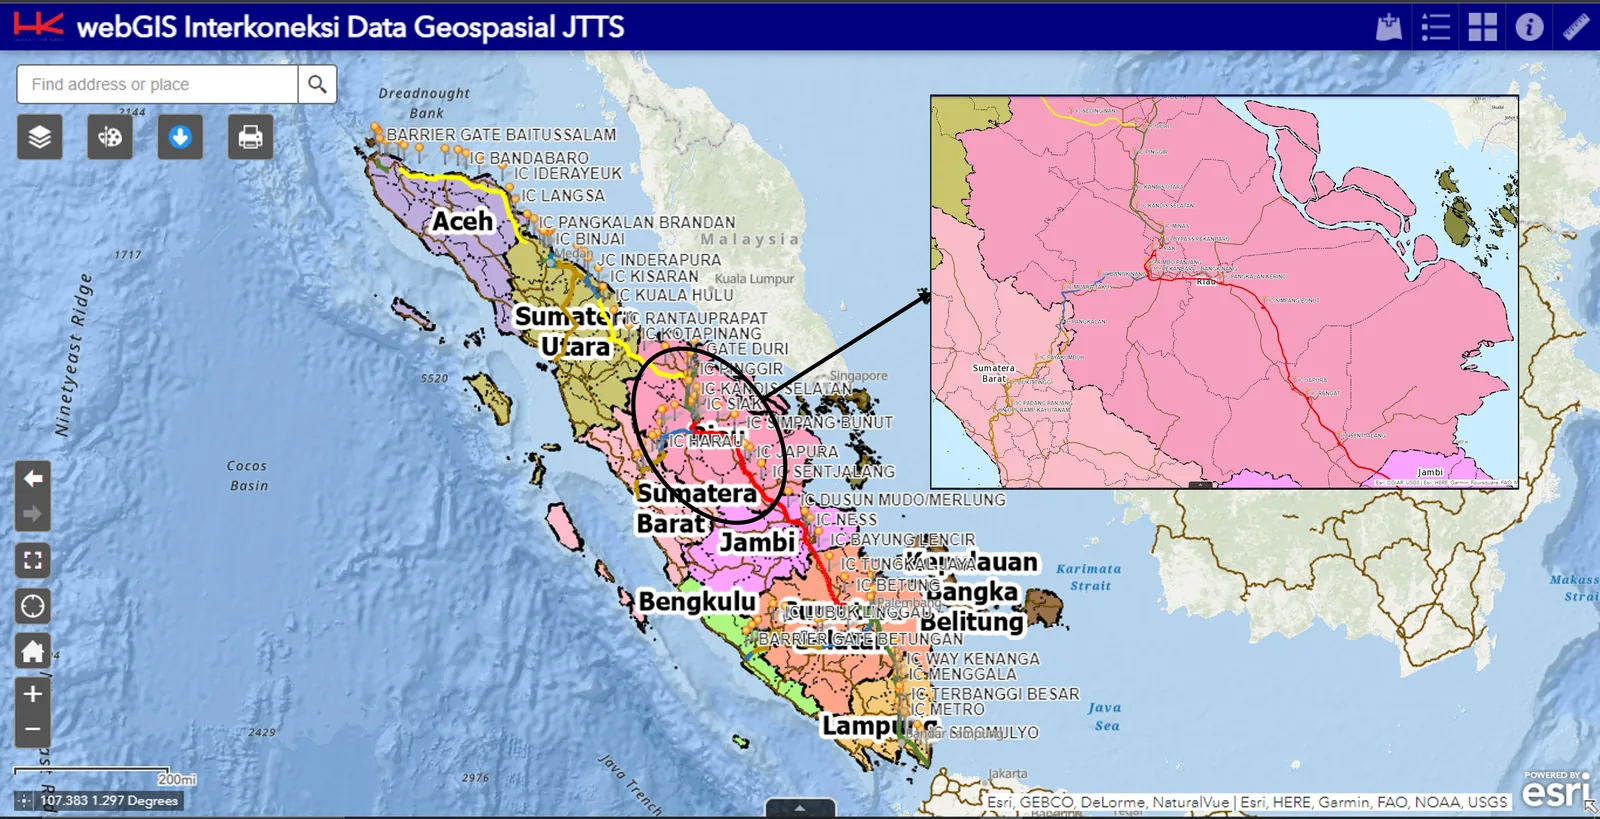
Engineered an optimized WebGIS application for PT Hutama Karya (Persero) to streamline the planning and visualization of the Trans Sumatra Toll Road (JTTS) megaproject. Addressing critical performance bottlenecks, I re-architected the spatial data delivery using Web Map Service (WMS) standards and developed custom functional widgets. The solution replaced a sluggish legacy system with a high-speed, interactive platform used for strategic route planning and asset management.

ArcGIS Web AppBuilderArcGIS EnterpriseArcGIS ServerJavascript

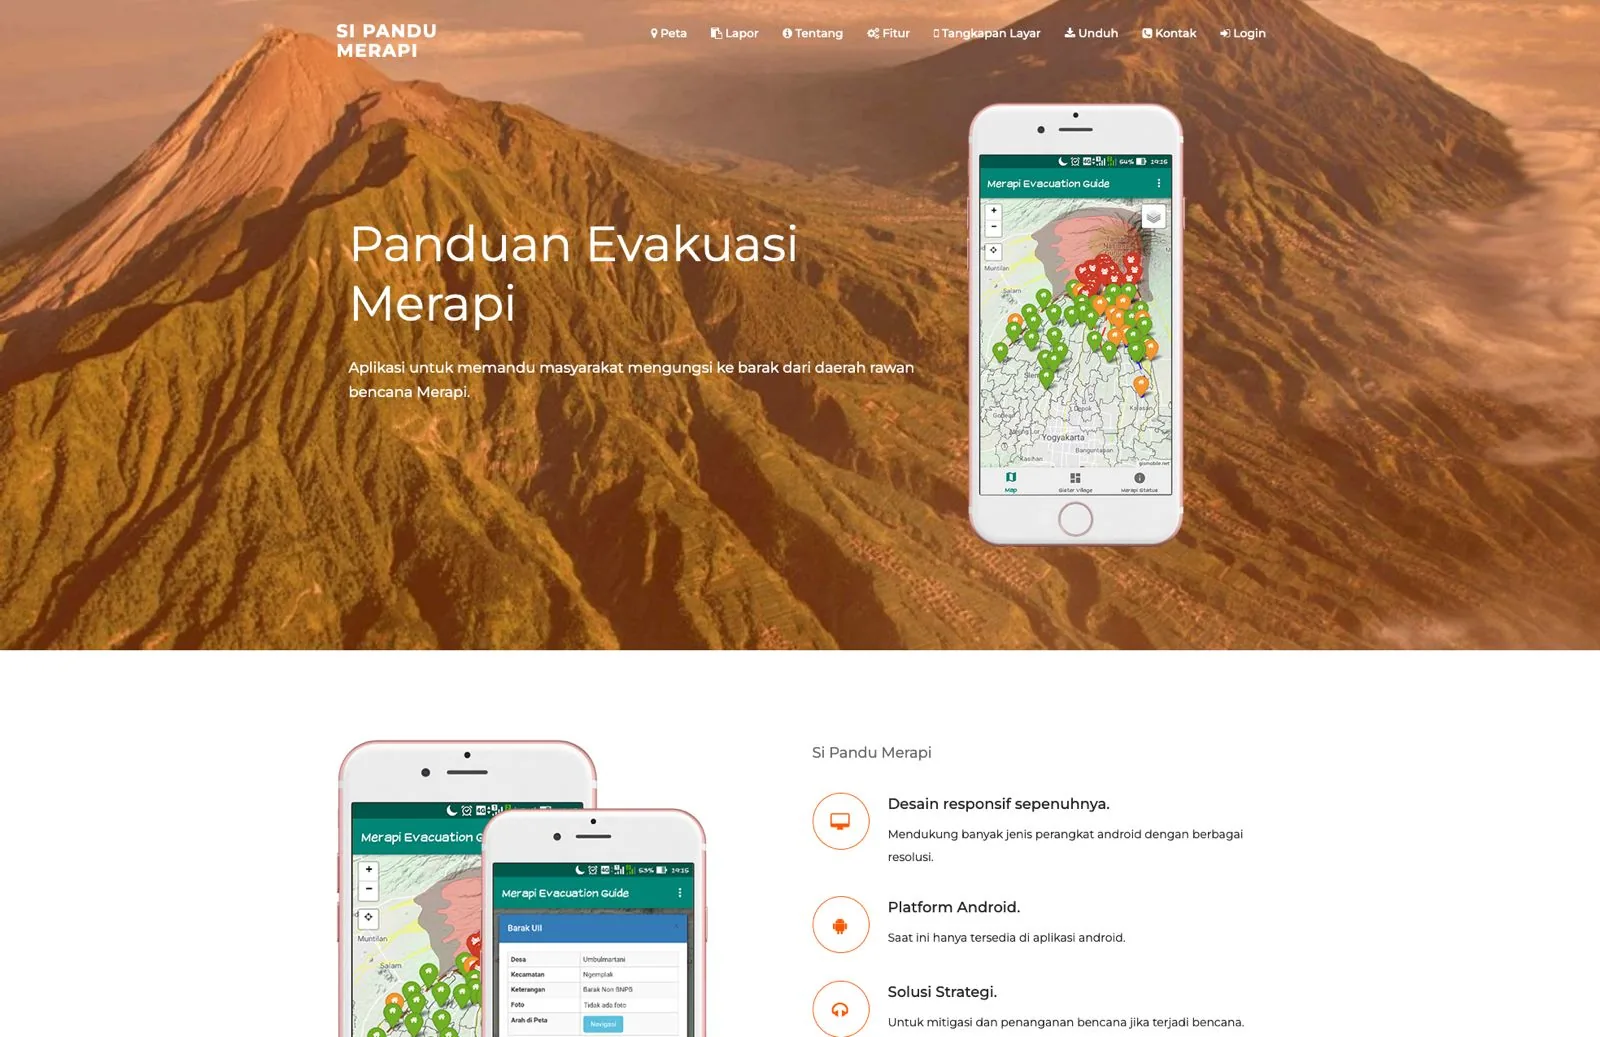
Led the enhancement of SiPandu Merapi, the official disaster response ecosystem for the Sleman Regional Disaster Management Agency (BPBD). The project bridged the gap between public safety and digital technology by developing a dual-interface system: a robust Web Admin Dashboard for operators to manage evacuation logic, and a user-centric Mobile Application empowering residents to report volcanic activity in real-time.

React NativeJavascriptLeaflet.jsReal-time Data Synchronization

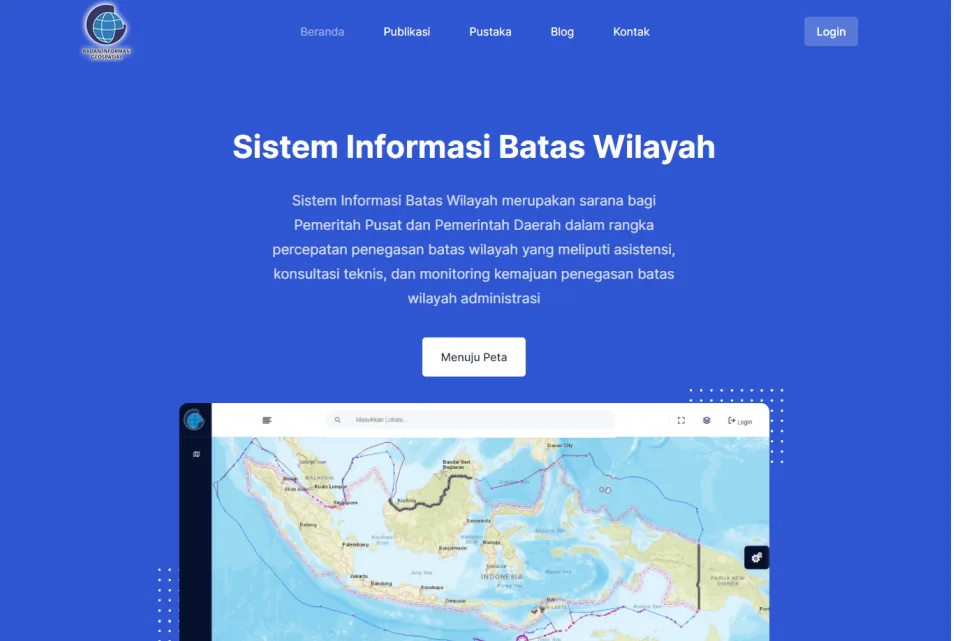
Contributed to the modernization of Sitaswil, the official boundary information system for the Indonesian Geospatial Information Agency (BIG). The project focused on enhancing the accessibility and security of administrative boundary data for central and regional governments. Key deliverables included a complete redesign of the landing page for better user engagement, the integration of advanced geocoding features, and the implementation of strict data security protocols tailored for government stakeholders.

PythonPostgreSQLGeoserverOSM Nominatim API

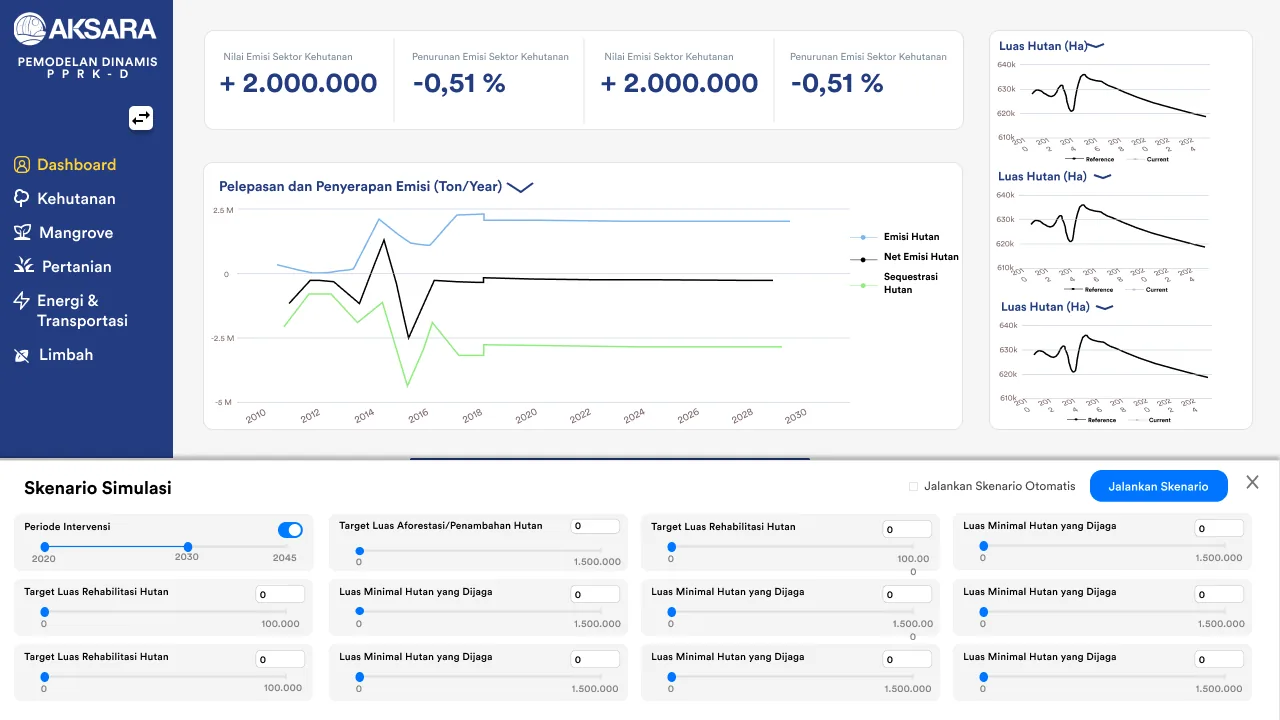
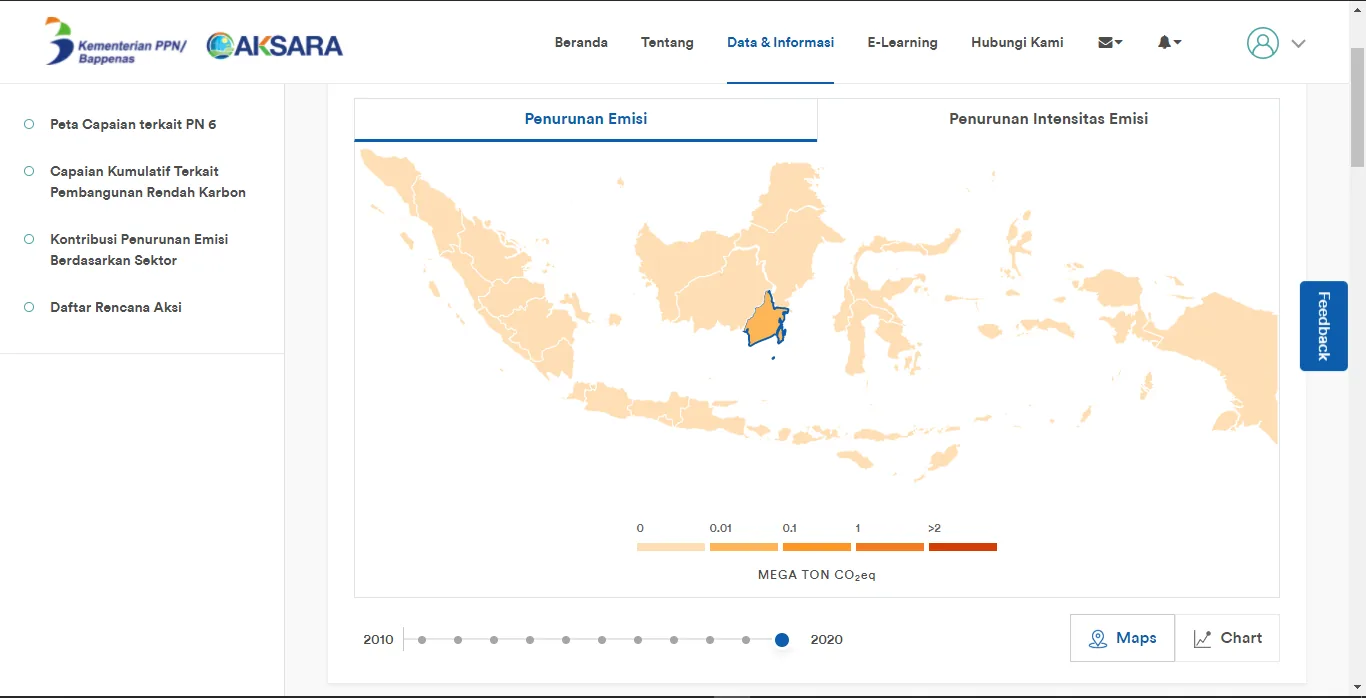
Led the comprehensive UI/UX redesign of the AKSARA WebGIS platform to address usability challenges and modernize the user experience. Leveraging Figma, I conducted a visual audit of the legacy interface and engineered a new, intuitive design system. The overhaul transformed a text-heavy interface into a clean, dashboard-style layout with improved visual hierarchy, making complex climate data simulation tools accessible to non-technical stakeholders.

FigmaUI/UX Design PrinciplesData Visualization DesignUser Flow Analysis

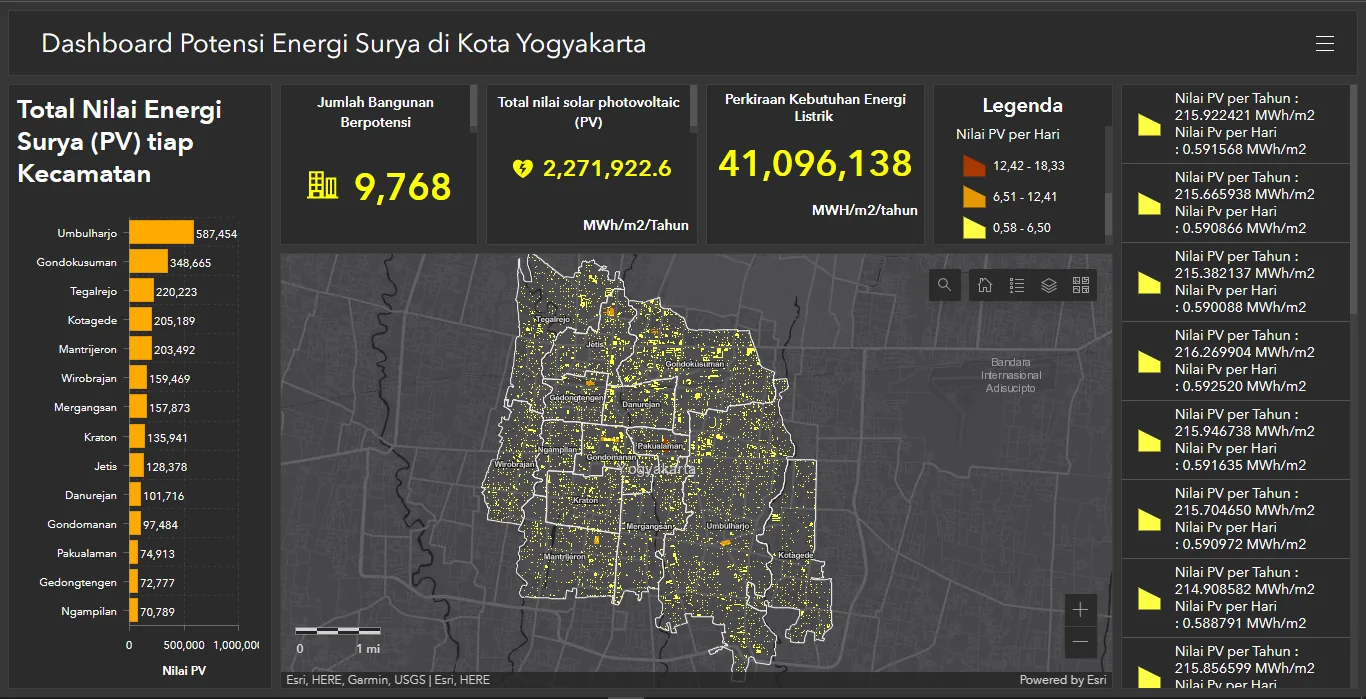
Developed a high-precision spatial analysis dashboard to map and quantify solar energy potential across Yogyakarta City. By integrating solar radiation data with building footprint layers, the system calculates the Photovoltaic (PV) potential for individual structures. This tool empowers city planners and stakeholders to identify high-yield zones for renewable energy adoption, supporting Yogyakarta's transition toward a sustainable smart city.

ArcGIS DashboardArcGIS ProArcPyData Visualization

Spearheaded the backend development for the Climate Resilience module of the AKSARA platform, a strategic initiative by the Indonesian Ministry of National Development Planning (Bappenas). Engineered a robust interactive data collection system using Python Django and PostgreSQL, enabling seamless input, management, and geospatial analysis of national climate action data. The solution bridges complex database schemas with user-friendly interfaces to support national-level decision-making.

PythonPostGISDjangoPostgreSQL
Available for geospatial projects & technical consulting

Have a project, spatial challenge, or role in mind?

Let’s discuss WebGIS architectures, spatial data pipelines, or routing solvers tailored to your needs.

D

Portfolio Assistant

AI Guide · Online